July 30, 2012
by Liz Ann Sonders, Senior Vice President, Chief Investment Strategist, Charles Schwab & Co., Inc.
Key Points
- Household formations are moving higher but housing completions aren't keeping pace.
- Real mortgage rates plunge into negative territory.
- Key housing market index indicates continued sales (and pricing) recovery.
I've penned quite a few reports dedicated to housing over the past six years or so, the most recent being my "Rock Bottom" report in January of this year. I've also incorporated many of the charts I track into recent Market Snapshots videos. It's time for an update.
First, I wear no blinders hiding the truth that the recovery in housing is not yet "healthy" relative to history. The housing market will continue to be hampered by anemic job growth, "underwater" homeowners and the foreclosure pipeline. But the forces of demographics and supply/demand imbalances have begun to register their weight and the data has done a great job of reinforcing our message from earlier this year.
Laws of supply and demand
Current conditions in the economics of housing reflect a considerable imbalance between supply and demand. Many chapters have been written about the supply part of the imbalance (i.e., overbuilding), but less ink has been spilled on the role of weak demand specific to declining household formations in since 2007. The National Association of Home Builders' (NAHB) HousingEconomics.com division concludes that two-thirds of excess vacant housing units in the existing housing stock can be attributed to a steep decline in demand during the recession.
Household formations (e.g., adult children leaving parents' households, singles leaving shared housing arrangements, etc.) are the largest component of demand for additions to the housing stock. These new households are accommodated by additions to the housing stock when vacancy rates are low, and are absorbed into the existing stock when vacancy rates are high. There's a strong trend component to growth in the number of households, but formations are influenced by economic conditions—rising during good times and declining during bad times.
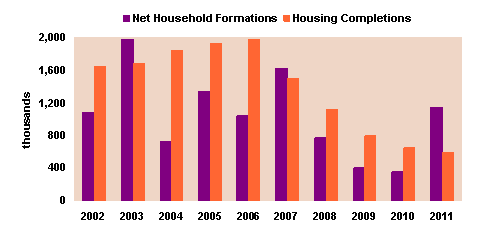
In the history of the data, the biggest declines in household formations occurred around recessions and bear markets. The 2010 drop in formations set a modern-day record, as seen in the chart below.
Boomerang Kids Moving Out of Parents' Homes

Source: ISI Group, US Census Bureau, as of 2011. Household formations are calculated as the difference in households this year versus the past year.
A large gap is now developing as household formations surge from their recent base, while home completions lag behind. HousingEconomics.com suggests that a considerable portion of the excess housing supply (NY Fed president William Dudley recently estimated three million units) is due to a steep decline in demand related to economic conditions, rather than overbuilding. This has important implications: if excess housing supply was "pure" supply (i.e., assuming no pent-up demand), then recovery would take as long as it would take for demographic forces to catch up with supply. But, given that the excess supply embodies pent-up demand, then the recovery in housing will probably unfold more quickly than many believe.
Whether measured in terms of months' supply or as a percentage of the working population, inventories of homes for sale have fallen dramatically since their peak. Inventories of single-family homes are down 24% from a year ago—the largest annual drop in at least 30 years, leaving inventories at roughly the historic levels that preceded the housing bubble. The number of homes for sale normalized for potential buyers (working age population) is now at a record low. This helps to explain the recent weaker home sales reports, which brought a few housing bears back out of hibernation. Existing home sales fell more than 5% in June to the lowest level in eight months. But, the prior month was revised up nicely and sales remain up more than 4% from a year ago. Looking deeper, the National Association of Realtors noted the decline in June was due to "tight supplies of affordable homes, limiting first-time buyers." Another good sign is that despite weaker sales, median existing home prices shot up, reaching their highest level since September 2008. Real median home prices are up over 5% on a year-over-year trend basis, which is the most since March 2006, before the bubble burst.
Mortgage rates … get real!
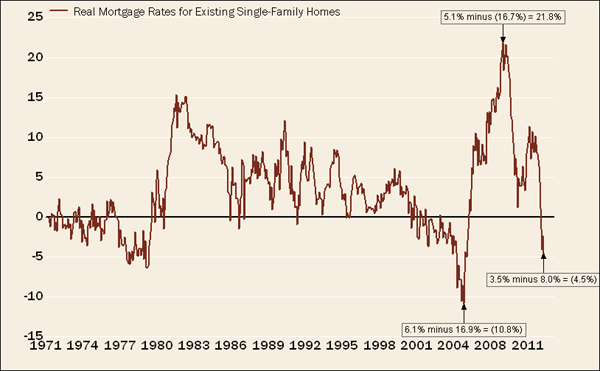
Home prices are important for the obvious reasons, but also as an input into what I think is one of the most important housing metrics—the real mortgage rate. We've seen plenty of good news on the nominal mortgage rate front. The nominal 30-year fixed mortgage rate is now a record low 3.5%, but the "real" mortgage rate is even lower—in fact, it recently went negative.
Many long-time readers know that I pay more attention to the real mortgage rate (RMR) than the nominal mortgage rate. Just like real gross domestic product (GDP) is the difference between nominal GDP and inflation, the RMR is the difference between the nominal mortgage rate and the rate of appreciation (or depreciation) in median home prices. Why should we look at it this way? It's not only the rate at which we're borrowing that matters, but what's happening to the price of the asset we're borrowing to buy. See the chart below, which tracks the RMR back to the early 1970s.
Real Mortgage Rates Plunging

Source: FactSet, Federal Reserve, National Association of Realtors, National Bureau of Economic Research (NBER), as of June, 2012.
At the peak in the bubble, RMRs were -11% (6% nominal mortgage rate minus 17% appreciation rate). Fast-forward to the trough of the housing bust and RMRs had surged to 22% (5% nominal mortgage rate minus a 17% depreciation rate). No wonder the bubble burst: who would want to borrow at any rate to buy a rapidly depreciating asset? But today, RMRs are back in negative territory. It makes sense again to borrow to buy a house since home prices are now appreciating at a rate higher than the mortgage rate.
Surging housing market index
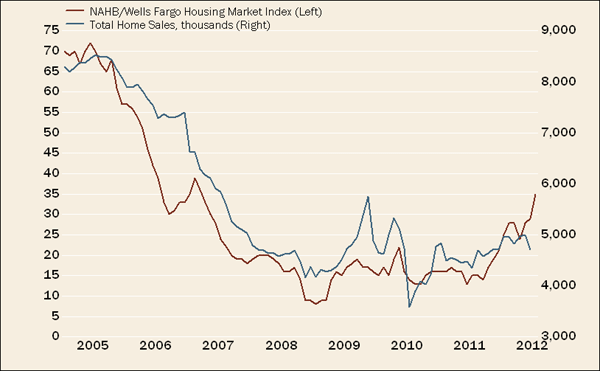
The NAHB/Wells Fargo Housing Market Index (HMI) is one of the most watched housing metrics and is based on a monthly survey of the National Association of Home Builders' members. It gauges builder confidence about the single-family housing market and is a weighted average of market conditions for current new home sales, sales expectations for the next six months, and traffic from prospective buyers. As you can see in the chart below, there has historically been a tight relationship between the HMI and total home sales; and the latest jump is "forecasting" more sales to come.
Housing Market Index Suggests Higher Sales

Source: FactSet, National Association of Home Builders (NAHB), National Association of Realtors, US Census Bureau. NAHB Housing Index as of July, 2012. Total Home Sales (existing and new) as of June, 2012.
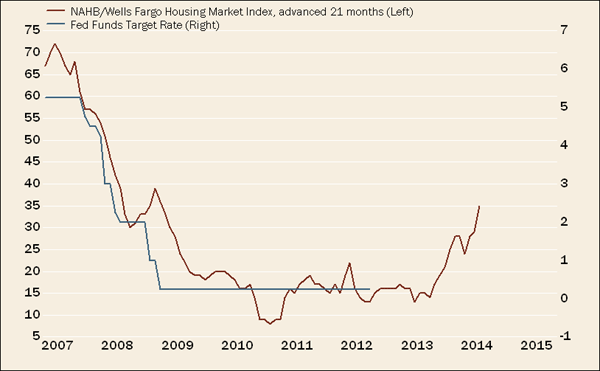
As an aside, I recently discovered (thanks to Wolfe Trahan) the relationship charted below, which compares the HMI (advanced 21 months) to the fed funds rate (which has effectively been zero since late 2008). Historically the two have been highly correlated. This should not serve as any kind of "warning" that the Fed will be raising rates sooner than it's telegraphed (late 2014)—the Fed is making decisions on more than just trends in housing—but it will be something I am tracking.
Will Housing's Recovery Alter Fed Policy?

Source: FactSet, Wolfe Trahan & Co., as of July 30, 2012.
Echo boomers to the rescue
I recently read the "State of the Nation's Housing" report by the Joint Center for Housing Studies of Harvard University. In it was a discussion of demographics and I'll conclude with some of their most interesting observations. "Assuming the economic recovery is sustained in the next few years, the growth and aging of the current population alone—including the entrance of the echo boomers into adulthood—should support the addition of about one million new households per year over the next decade." The report also suggested adding at least another 180,000 to that estimate from immigration. Due to these demographic trends, it's a decent bet that demand will continue to revive, even if job growth remains weak.
One of the concluding comments from the report was its most compelling: "The good news for housing production is that this new generation already outnumbers that of the baby boomers at the same ages. With even a modest lift from immigration, the echo boom generation will grow even larger as its members move into the prime household formation years."
Important Disclosures
The information provided here is for general informational purposes only and should not be considered an individualized recommendation or personalized investment advice. The investment strategies mentioned here may not be suitable for everyone. Each investor needs to review an investment strategy for his or her own particular situation before making any investment decision.
All expressions of opinion are subject to change without notice in reaction to shifting market conditions. Data contained herein from third party providers is obtained from what are considered reliable sources. However, its accuracy, completeness or reliability cannot be guaranteed.
Examples provided are for illustrative purposes only and not intended to be reflective of results you can expect to achieve.
Copyright © Charles Schwab & Co., Inc.


