by Guy Lerner, The Technical Take
Our bond model has issued a sell signal.
The bond model is based upon intermarket variables including inputs from commodities and utilities. The model first issued a buy signal on March 30, 2012. Since that time the Vanguard Total Bond Market Fund (symbol: BND) is up 1.9%. This ETF also closed at a new all time high on Friday. The i-Shares Lehman 20 + Year Treasury Bond Fund (symbol: TLT) is up 15% since March 30, 2012. The out performance of TLT is thought to be due to Operation Twist, as the Federal Reserve has been actively buying at the long end of the yield curve to push down interest rates. From March 30, 2012 to July 14, 2012, the SP500 loss 3.7%.
It has been my contention that the buy signal back in March was an early sign of economic weakness. This has turned out to be the case over the past 3 months as important data inputs, like ISM and unemployment, have been softer than expected. I don’t believe we are in recession (personal data), and at best, the US economy has stabilized with growth being below trend.
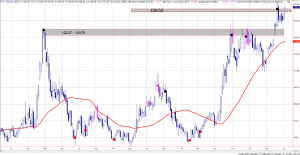
From a technical perspective, TLT looks like one of the best charts in my Chart Book. See figure 1, a weekly chart. Price must remain above the 128.52 key pivot point (support level) to avoid being a double top. Considering that our fundamental model has issued a sell signal, I would suspect TLT will struggle going forward.
Figure 1. TLT/ weekly

Copyright © The Technical Take


