


Choosing the Right Asset Class in Emerging Markets: Why it Matters
- Depending on individual risk tolerances during the past five years, it may have made more sense to overweight one or two EM asset classes and at times to avoid one or two EM asset classes altogether.
- In general, asset classes are better viewed as carriers of risks rather than each being considered a risk in its own right. This phenomenon is readily apparent in the emerging market space.
- We have advocated that asset allocation in EM should be dynamic with respect to both segment and country. This is an important consideration of the EM investment process.
At the dawn of the automotive age, Henry Ford famously said, “Any customer can have a car painted any color that he wants so long as it is black,” in response to complaints about the lack of color options. Similarly, investors focused on the emerging markets (EM) asset class prior to 1996 could invest in any asset class within emerging markets so long as it was equities. But just like Mr. Ford adjusted his product offering in response to demands for more customization, investment firms began to recognize that the EM product suite was capable of supporting additional strategies beyond equities.
EM investment options are growing
In response, in February 1995, J.P. Morgan launched the first EM fixed income index: the Emerging Markets Bond Index (the EMBI) which generally tracked Brady Bonds. This index evolved into the EMBI+ and the EMBI Global a few years later when EM countries began to regularly issue bonds in the international capital markets. In June of 1996, the Emerging Local Markets Index (ELMI) followed and tracked EM local currency money market instruments. The ELMI became the ELMI+ in November 1997 and benchmarked EM currency forwards instead of money market instruments.
During the nine years following the 1996 introduction of the ELMI, investors looking to benchmark their EM assets to widely-used indexes were limited to equities, external sovereign debt and currencies. So in June 2005, J.P. Morgan complemented its traditional global government bond indexes with the GBI-EM (the GBI). The GBI and its variants tracked investments in EM local bonds. As the breadth of opportunities within EM expanded, J.P. Morgan devised an additional benchmark, launching the CEMBI family of indices in November 2007. The CEMBI was the first widely used benchmark for EM corporate bonds.
Today, investors can express their EM views through asset classes focusing on:
- external sovereign bonds,
- U.S. dollar-denominated corporate bonds,
- local currency-denominated bonds,
- currencies,
- equities,
- or combinations of these strategies.
Not all EM investment returns are created equal
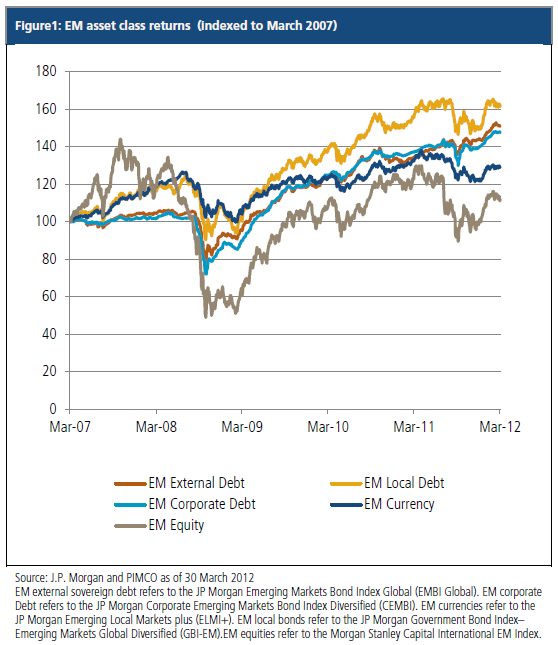
Figure 1 shows that the various EM asset classes have produced very different returns during the past five years. Depending on individual risk tolerances, it may have made more sense to overweight one or two EM asset classes and at times to avoid one or two EM asset classes altogether.
A compelling case could also be made in favor of allocating to EM on a blended basis, combining various EM asset classes.
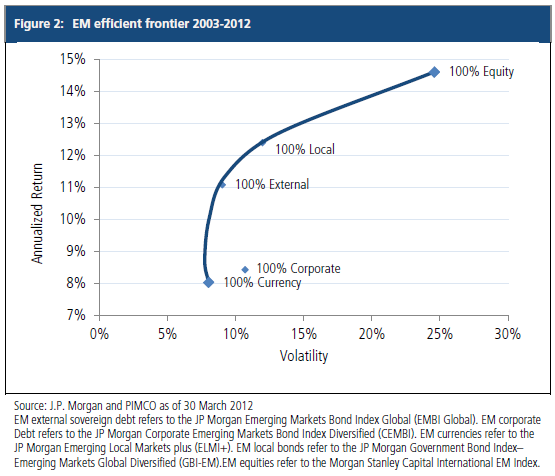
While the past five years illustrate the importance of EM asset allocation, it is a somewhat atypical time period during which we saw the EM asset class with the highest volatility (equities) offer the lowest return. Thus if we were to consider an efficient EM frontier, including more history would allow us to plot a more accurate curve. This is why when constructing an efficient frontier, we look as far back as 2003, the earliest date for which return information is available for all the EM assets discussed in this piece. We then examine returns for each EM asset class’s respective benchmark and determine an efficient frontier for the combination of EM asset classes.
Figure 2 shows the range from which investors can select a preferred allocation based on individual return/yield objectives and risk tolerances. The frontier ranges from 100% equities at one end to 100% EM currencies at the other. While the “100% External” asset class may appear to offer the best risk/reward tradeoff for this period, please keep in mind that this frontier covers a relatively brief period of time (less than ten years), that we expect this dynamic asset class to evolve significantly in the future, and that many individual investors will want to position at different points on the curve, depending on their own risk tolerance levels. For these investors, we believe allocating to other points on the curve can be best achieved by allocating to combinations of strategies within the EM asset class.
Today, investors are facing outcomes that are distributed in a bimodal fashion (an expected distribution of returns that shows two peaks, instead of one, when plotted). So, while PIMCO believes the secular outlook for EM assets remains generally bullish, especially compared to the developed world, the road will be bumpy. This implies that the asset allocation decision within an EM portfolio is one of the most important considerations in EM investing.
“Factors” to consider in EM investing
At an abstract level, the process of investing is largely one of deciding which types of securities appropriately capture an investor’s view. The selection and sizing of positions – asset allocation – aims to achieve some desired level of expected return at a given level of perceived risk. Investors have historically simplified this process by assigning labels to asset classes that signal the type of risk that asset class (and that asset class exclusively) embodies: equities, bonds, commodities, etc. By cleanly isolating a particular risk, deciding which assets we want to hold in light of our view becomes much easier. In addition, even though assets may be correlated, if the labels are truly what distinguish various assets, diversification is more easily achieved. Of course, this approach has the additional benefit of being easily managed with a simple spreadsheet.
Gyrations of financial assets in recent years help to highlight the shortcomings of this approach. The shortcuts of traditional asset class definitions (both the mental and spreadsheet kinds) neglect that asset classes can be exposed to multiple “risk factors.” Put differently, asset classes are better viewed as carriers of risks rather than each being considered a risk in its own right. This phenomenon is readily apparent in the emerging market space.
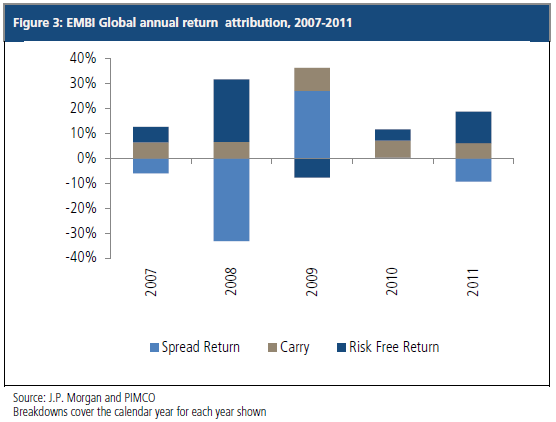
Figure 3 attributes the total return of the JP Morgan EMBI Global Index over three sources:
- Spread return: U.S. dollar-denominated EM bonds are a “spread product.” A portion of the return that investors earn owes to compensation for the risk of default, which we measure by looking at the spread of EM bonds over U.S. government bonds of similar maturity. An increase (or decrease) in investors’ willingness to hold EM risk will cause spreads to move lower (or higher). This spread move in turn will produce a gain or loss in proportion to the spread duration of the bond in question. With these two components – spread change and spread duration – we can measure the return produced by changes in the compensation demanded by investors for bearing default risk in EM which is shown in the chart as the light blue shaded portion of the stack.
- Risk-free return: The flip-side of attributing some portion of return to changes in perceived riskiness of EM is that we can also isolate the return owing to changes in the underlying so called “risk-free rates”* over which the spreads discussed above are measured. The exercise is also similar: changes in U.S. Treasury yields of the same average maturity as the bonds in the index will impact returns in proportion to the interest rate duration of the index. The dark blue column shows the contribution to return from movements in the yields of the U.S. Treasury bonds over which emerging market debt spreads are measured.
- Carry: As with most fixed income instruments, EM bonds pay periodic coupons which also contribute to the total returns investors receive. This is shown graphically below in the tan-shaded portions of the stacks.
We believe a factor-based analysis provides a richer explanation of why asset classes behave as they do. In 2011, concerns over the health of the U.S. economy and the strains of peripheral Eurozone countries caused investors to position more defensively. EM spreads widened predictably, and the 138 basis point widening in spreads detracted 9.3% from the total return of the EMBI Global.
However, U.S. Treasury yields rallied as investors de-risked. The decline in 10-year Treasury yield from 3.3% to 1.9% and the salutary effect on the Treasury-sensitive component of EM bonds more than offset the losses stemming from wider spreads, contributing 12.7% to the index return. When combined with the 6.1% of carry from the index, U.S. dollar-denominated emerging market debt posted returns that were among the strongest across all fixed income asset classes.
These risk factors are instructive insofar as they help us to identify the underlying drivers of asset class performance. However, repeating the exercise over many different types of assets highlights that these risk factors actually overlap or are “shared” across asset classes. In 2008, for example, nearly all financial assets (except U.S. Treasuries) simultaneously declined in value, which market commentators chalked up to “correlations going to 1.”
A more accurate description might be to say that a single risk factor (see below) dominated the performance of all these assets during this period of acute stress. Importantly, many of these risk factors represent common-sense concepts: equity risk factor, duration factor, credit factor, etc. In fact, we view the dramatic spread widening of credit asset classes (investment grade, high yield, EM) that took place in 2008 as a result of their exposure to the equity risk factor.
Moreover, if risk factors are shared among asset classes and vary over time in their influence on particular asset classes, we can combine asset classes along an efficient frontier to achieve an exposure which aligns a portfolio with our view on as many risk factors as we can identify. As we illustrated in Figure 2, this ultimately allows investors to move along an efficient frontier in an effort to maximize returns given their risk preferences.
Applying risk factors to EM asset allocation
We have addressed the importance of a flexible asset allocation strategy within EM investing. Such a strategy allows investors to adjust their portfolio level exposure to EM sovereign and corporate debt, currencies and equities depending on overall risk tolerance levels and changing views on creditworthiness, economic growth, interest rates, currencies and equity risk premiums. These changing views imply that optimal allocations to different EM asset classes at the portfolio level may fluctuate, sometimes substantially, across a market or economic cycle.
On the other hand, within a given country, asset allocation may be less prone to frequent changes. The key to allocation across a country capital structure is to accurately gauge when key risk/reward inflection points occur so investors can dial up or down their risk exposures accordingly.
EM countries often reward investors differently
Some EM countries may secularly be primed to favor certain asset classes over others during relatively long investment horizons. Some with a history of inflation use high real interest rates to burnish their inflation fighting credentials – a positive for local bonds but not so much for equities. Others have structurally weak external balances that may lead to higher inflation and weaker currencies – a boon for equity markets but bad news for local bonds. Other countries simply have external debt with credit spreads trading at levels that are too narrow compared to other EM countries and even to developed ones.
To illustrate these points, look at Brazil and Russia: In the case of Brazil, investors have a full array of options including equities, local bonds and currency as well as sovereign and corporate external debt to express a bullish view on the country. The generalized improvement in Brazil’s economic fundamentals and creditworthiness produced positive returns across all of these different asset classes. But some returns were higher than others (see Figure 4).
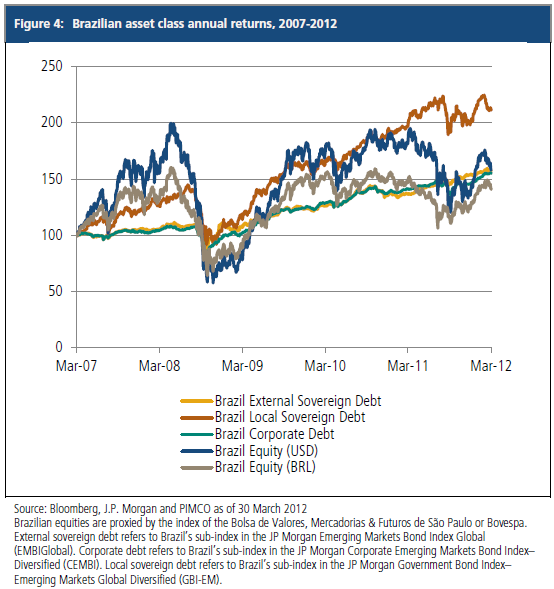
We can see this more clearly when we observe the performance of Brazil external sovereign debt relative to the country’s local bond markets. Investing in Brazil’s external debt would have yielded a 57% return with 9% volatility during the referenced period.
However, a dollar invested in Brazilian local bonds market would have returned 112% with a volatility of 14.78%. Brazil’s high real interest rates – the highest in the world throughout most of this period – helped produce attractive returns for local bonds and contributed to the appreciation of the Brazilian currency, the real, during the period. High nominal interest rates, a byproduct of high real rates, also created a significant equity risk premium for Brazilian equities during the period. Thus, Brazilian equities delivered only a 41% return (in real terms) with 26% volatility during the period. The appreciation of the real meant that a dollar invested in Brazilian equities would have returned 58% in dollar terms but with volatility of 46%. So on a risk-adjusted basis, a dollar-based investor would have been far better off having favored Brazilian local bonds over any other Brazilian asset class during this period.
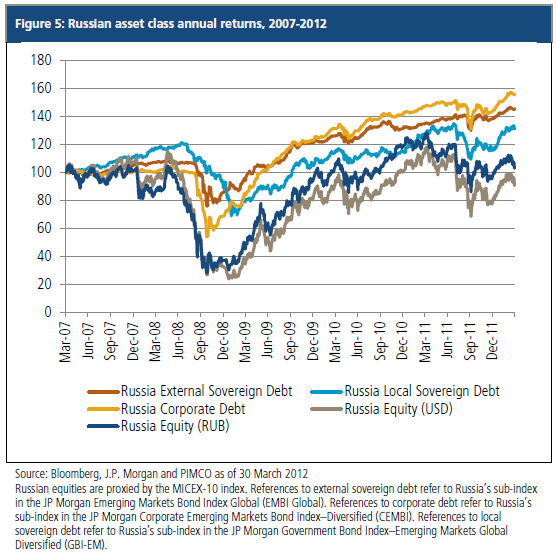
In the case of Russia, Figure 5 illustrates a slightly different story. Investing in Russian dollar-denominated corporate debt would have returned 56% with a volatility of 12% for the same five years, the best of any Russian asset class on a risk-adjusted basis. A portfolio of only Russian dollar corporate bonds or perhaps even a blended portfolio of Russian corporate and external debt would have been a better risk-adjusted way to play the emergence of Russia.
While some EM countries have limited investable asset classes
Some countries such as India, China and Venezuela offer a very limited selection of investable assets from which to choose. India and China each have very little tradable sovereign external debt. They also have strong controls on foreign investment into local equity and bond markets. This leaves investors bullish on these two countries’ strong fundamentals with only three investable asset class choices – non-deliverable currency forwards, equities and corporate bonds. The external debt of the Republic of Venezuela and its state-owned oil company are the only liquid securities investors can effectively use to express their views on the country.
More choices require asking the right questions
With so many choices on the menu, anyone investing in EM over a three- to five-year (or longer) market cycle should ask themselves three key questions relative to their individual investment goals and risk tolerances, whether they execute the EM asset allocation decisions themselves or hire an investment manager:
- Which EM asset class(es) offer(s) the best risk/reward opportunities?
- Should EM asset classes be combined to improve risk-adjusted returns?
- Will the investor be able to correctly identify inflection points when one EM asset class will begin to outperform or underperform another with an eye towards adjusting asset class allocations?
Finally, we have advocated that asset allocation in EM should be dynamic with respect to both segment and country. This is an important consideration of the EM investment process.
Past performance is not a guarantee or a reliable indicator of future results. All investments contain risk and may lose value. Investing in the bond market is subject to certain risks including market, interest-rate, issuer, credit, and inflation risk; investments may be worth more or less than the original cost when redeemed. Equities may decline in value due to both real and perceived general market, economic, and industry conditions. Investing in foreign denominated and/or domiciled securities may involve heightened risk due to currency fluctuations, and economic and political risks, which may be enhanced in emerging markets. Currency rates may fluctuate significantly over short periods of time and may reduce the returns of a portfolio.
Statements concerning market trends are based on current market conditions, which will fluctuate. There is no guarantee that these investment strategies will work under all market conditions, and each investor should evaluate their ability to invest for the long-term, especially during periods of downturn in the market.
The J.P. Morgan EMBI Global tracks total returns for US dollar-denominated debt instruments issued by emerging market sovereign and quasi-sovereign entities: Brady bonds, loans, Eurobond. References to country specific external sovereign debt refers to that country’s sub-index in the J.P. Morgan EMBI Global. The J.P. Morgan CEMBI tracks total returns of US dollar-denominated debt instruments issued by corporate entities in Emerging Markets countries. References to country specific corporate debt refers to that country’s sub-index in the J.P. Morgan CEMBI. The J.P. Morgan ELMI+ tracks total returns for local-currency denominated money market instruments in 23 Emerging Markets. References to country specific local currencies refer to that country’s sub-index in the J.P. Morgan ELMI+. The J.P. Morgan GBI-EM consists of regularly traded, liquid fixed-rate, domestic currency government bonds to which international investors can gain exposure. References to country specific local sovereign debt refers to that country’s sub-index in the J.P. Morgan GBI-EM. The Morgan Stanley Capital International (MSCI) EM Index which is a free float-adjusted market capitalization index that is designed to measure equity market performance of emerging markets. It is not possible to invest directly in an unmanaged index.
This material contains the current opinions of the author but not necessarily those of PIMCO and such opinions are subject to change without notice. This material is distributed for informational purposes only. Forecasts, estimates, and certain information contained herein are based upon proprietary research and should not be considered as investment advice or a recommendation of any particular security, strategy or investment product. Information contained herein has been obtained from sources believed to be reliable, but not guaranteed. No part of this article may be reproduced in any form, or referred to in any other publication, without express written permission of Pacific Investment Management Company LLC. ©2012, PIMCO.


