by Guy Lerner, The Technical Take
Until proven otherwise, central banks will continue to devalue their currencies and intervene in markets because if they didn’t “life as we know it would not exist”. This is the sole basis for understanding the positive fundamentals behind gold. Period. Economic weakness leading to lower interest rates is very gold positive. But sometimes the price action gets divorced from the fundamentals, and this appears to be the case with gold. Price is breaking down despite the positive fundamentals.
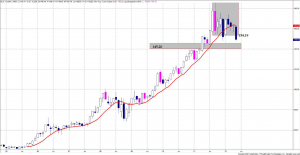
Figure 1 is a monthly chart of the SPDR Gold Trust (symbol: GLD). The pink labeled bars are negative divergence price bars. (The divergence is between price, which is heading higher, an oscillator that measures price, which is heading lower.) What we know about negative divergence bars is that their presence signifies slowing upside momentum such that price usually consolidates within the highs and lows of the negative divergence bar itself. The low of the most recent negative divergence bar is 154.19, and a monthly close below this level would imply lower prices. Based upon this analysis, the next level of support is at 145.20.
Figure 1. GLD/ monthly

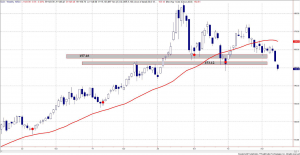
Figure 2 is a weekly chart of the GLD. Price has gapped below the 153.12 support level. Old support is new resistance. Such breaks in the price structure are never good and imply further selling.
Figure 2. GLD/weekly

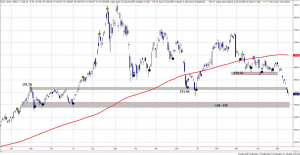
Figure 3 is a daily chart of the GLD. The red and black dots are key pivot points, which are the best areas of buying (support) and selling (resistance). Note the gaps in price as the 158.20 and 151.96 price levels were broken. The next area of support is at 144 to 145.
Figure 3. GLD/daily

In summary, the price action in GLD is ugly and incongruous with the fundamentals. As I see it, there are two ways to play this. You can buy into further weakness, and this would be the support level at 144.145. Or you buy into strength and that would be when price closes above the 151.96 resistance level.
Copyright © The Technical Take


