by Guy Lerner, The Technical Take
Despite the highs in gold being well over 6 months ago, I have remained constructive (see here and here) viewing the extended pull back as nothing more than a consolidation of the prior move. The fundamental back drop for gold remains strong as well. It is my belief (of course, supported by the data) that current economic pressures are gold positive as central bankers will continue to intervene in markets via their preferred vehicle of pushing interest rates lower.
Figure 1 is a monthly chart of the SPDR Gold Trust (symbol: GLD). The pink labeled price bars are negative divergence bars. As I have shown many times, the presence of negative divergence bars is more of a sign of slowing upside momentum. Furthermore, price tends to travel within a range defined by the highs and lows of the negative divergence price bar. The negative divergence bar printed 8 months ago. As expected, price remains within a range, and it is currently at the low end of that price range, which is at 154.19.
Figure 1. GLD/ monthly

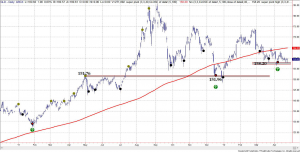
Breaking the price structure down even further, we turn to a daily chart of GLD. See figure 2. The gold and black dots are key pivot points, which define the best areas of support (buying) and selling (resistance). The combination black and red dots are “super” pivot points — for lack of terminology — and are more selective in determining areas of support and resistance. Focus on the “super” pivot points (green up arrows). Prior to the current “super” pivot, there have been 10 “super” pivot points printed since 2005. 9 out of 10 these super pivot points have marked the low point for the subsequent up move that followed.
Figure 2. GLD/ daily

The “super” pivot at 158.20 is support, and within the context of positive fundamentals, this should represent a good buying point. A monthly close below 154.19, which is the low of the monthly negative divergence bar, would be reason enough to re-consider this trade.
Copyright © The Technical Take


