Does GOLD Still Glitter?
by James Paulsen, Chief Investment Strategist, Wells Capital Management (Wells Fargo)
Gold has been an investment darling in recent years. Indeed, it is often perceived as the cure for any investment worry. Whether you are concerned about inflation, deflation, government deficits, war, a U.S. dollar collapse, recession, or depression—GOLD is the answer!
The extraordinary popularity of gold today is easy to understand—it has done so well for so long! Since the end of the 1990s, the price of gold has risen almost six-fold from less than $300 to its current price of almost $1,700. Many expect the price of gold to rise considerably higher in the next several years and perceive the modest decline in the gold price since its all-time peak last September as a buying opportunity. While owning some gold is fine for all investors (diversification is paramount), we think gold weightings should be scaled back in most portfolios. The yellow metal may soon lose some of its luster as its struggles with its newly elevated valuation and with the likelihood that confidence throughout the economy is beginning to improve.
Gold is OVERVALUED!
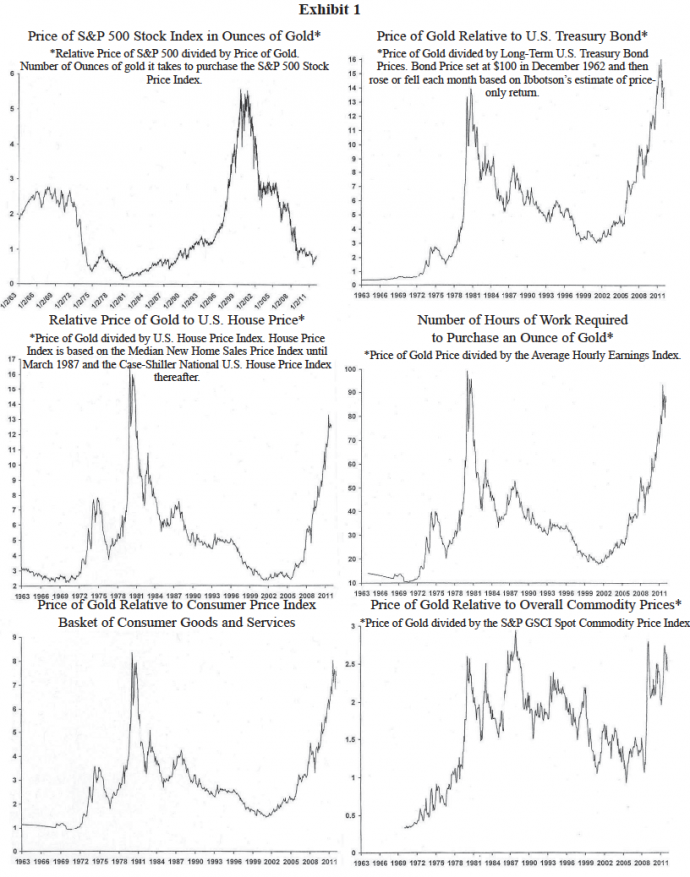
Unlike stocks or bonds, gold has always been more difficult to value since it produces no cash flow (i.e., earnings or coupons) that can be discounted to arrive at a present (fair) value. However, Exhibit 1 illustrates a simple “relative valuation” methodology providing an historical perspective against most other investment classes (e.g., stocks, bonds, commodities, and real estate) and relative to the value of labor and a basket of consumer goods and services. In each of the six charts shown, the price of gold on a relative basis is either nearing or is at one of its highest valuations of the last 50 years. At the end of the 1990s, it took almost 5.5 ounces of gold to buy the S&P 500 Stock Price Index. Today, it only takes 0.8 of a single ounce to buy the stock market. Relative to stocks, gold is almost as expensive today as it was in the late 1970s when the price of gold had surged after its peg was eliminated and after the stock market was ravished by a decade of runaway inflation.
Relative to Treasury bonds, the price of gold currently trades near an all-time, post-war record high surpassing its old relative valuation record established in the late 1980s when bonds were incredibly cheap. It is indeed remarkable that gold today is this expensive relative to an asset class (bonds) which most agree is probably itself extremely overvalued.
In recent years, while gold prices have soared, U.S. home prices have collapsed. Although the price of gold relative to U.S. homes is not yet as high as it reached in the late 1970s, its current relative valuation compared to house prices leaves little optimism about the future potential for gold prices. Gold is also expensive relative to worker pay. In 2000, it took less than 20 hours of work (at the average hourly wage rate) to purchase a single ounce of gold. Today, by contrast, it takes almost 90 hours of labor to buy an ounce of gold! In a similar fashion, the price of gold relative to the basket of consumer goods and services comprising the Consumer Price Index is near its all-time record high reached in the early 1980s.
Finally, even compared to other commodity prices, the price of gold is nearing its all-time record relative price reached in the late 1980s. Even though commodity prices in general have increased significantly in the last decade, the price of gold has risen even more dramatically.
While valuation metrics have not traditionally been a good investment timing tool, they have provided a useful indication of the future upside/downside price potential of an investment. Relative to other investments, the charts in Exhibit 1 not only suggest upside is probably limited for gold but also cautions that downside price risk could be significant. At a minimum, these charts do not seem to support the widespread popularity and optimism concerning gold investing.
Gold and the “Fear Premium”?
Exhibit 2 shows the price of gold relative to other commodity prices. Although gold has been a spectacular investment since 2000, so have other commodities. Surprisingly, since 2000, the price of gold has only significantly outpaced other commodity prices during a few months in late 2008 when the “Great Financial Crisis” erupted. Between 2000 and late 2008, the relative price of gold to other commodities remained flat at about 1.5 implying both gold prices and other commodity prices rose by equal amounts during the period. Similarly, the relative price of gold was also unchanged between early 2009 and today. That is, “all” commodity prices rose just as much as gold prices between 2000 and late 2008 and again between early 2009 until today (despite this, however, general commodities remain a much less popular investment than gold).
The only time gold significantly outpaced other commodity investments was when investor “fear” surged. Exhibit 2 illustrates the “fear premium” the price of gold received relative to other commodity prices during the 2008 crisis and how much of this premium is still embedded in its price today. Between 2000 and late 2008, the price of gold oscillated in broad range about 1.4 times the value of the S&P GSCI Commodity Price Index. Today, gold trades at about 2.4 times the value of this commodity index. The risk or fear premium embedded in the price of gold (i.e., about 1.0, the difference between the relative price of gold today at 2.4 and where it used to trade prior to the 2008 crisis at about 1.4) is quite large and needs to be assessed when considering an investment in gold. A primary risk for gold investors is the potential for decay in this fear premium.
Gold’s Best Friend (Fear) May be Fading?!?
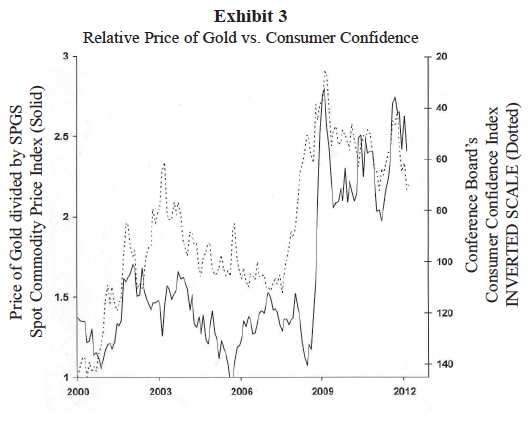
Exhibit 3 illustrates the challenge gold investors may face in the next few years should confidence slowly improve and “crisis fears” fade. This exhibit compares the relative price of gold to the Consumer Confidence Index. The confidence index (dotted line) is shown on an inverted scale so a rise (fall) in the dotted line illustrates periods when confidence is declining (increasing).
While not a perfect relationship, the relative price of gold relative to other commodity prices seems importantly driven by confidence. Gold’s best friend in recent years has been fear! As confidence collapsed in 2008, the relative price of gold far outpaced other commodity investments. Likewise, the decline in confidence after the tech wreck and after 9/11 in the early 2000s produced a similar “fear premium” in the relative performance of gold prices. However, between 2003 and 2007, the “fear premium” embedded in gold eventually evaporated once confidence again revived as the economic recovery matured. A similar revival in economic confidence may be emerging today. If the Consumer
Confidence Index does recover to at least 100 in this recovery, a good portion of the “fear premium” embedded in the price of gold may evaporate producing disappointing results for gold bugs.
Summary
Maintaining some gold exposure within portfolios makes sense. Should crisis fears continue to periodically flare in the next several years, gold should provide the portfolio with some defensive properties. However, we believe investors should consider reducing gold exposure. This is an investment which today seems far too popular among the masses, appears extremely overvalued relative to most other asset classes and faces a challenging environment should economic confidence slowly improve in the next several years. The valuation of gold relative to virtually any other asset class (stocks, bonds, real estate or commodities) seems to suggest the price of gold is either extremely rich today and at risk of significant decline or suggests most other asset classes are very cheap. Either way, it is probably time to position portfolios to benefit from a slow but steady revival in confidence rather than in an asset which only “glitters” when fear predominates.
Copyright © Wells Capital Management


