Has “Investor Risk” Really Increased?
by James Paulsen, Chief Investment Strategist, Wells Capital Management (Wells Fargo)
At least half of the investment challenge is the management of “risk” (the other, of course being return!). A widely accepted axiom, all else constant, is when the risk of a particular asset rises, portfolio allocations towards it should be reduced. The most common measurement of risk is price volatility and ostensibly, in the last several years, equity investors have faced regular bouts of extreme (perhaps unprecedented?) stock market movements. Accordingly, with a nod to longstanding investment wisdom, most have significantly reduced portfolio exposures toward risky assets in general and particularly towards the stock market.
Has this been a good strategy?
Has risk in the stock market (as defined by price volatility) really increased in recent years? This note examines the volatility of the U.S. stock market since 1900 and shows that while “trader risk” (i.e., price volatility over short periods of time like daily or weekly) has indeed leaped to levels not seen since the Great Depression, “investor risk” (stock price volatility over longer periods) is not noticeably different than it has been throughout the post-war era. Many investors with multi-year horizons, swayed by eye-catching daily price swings into believing stock market “investor” risk has been significantly elevated, could be mistakenly lessening exposures to risk assets due to elevated short-term volatility which is not impacting longer-term investment risk.
“Trader Risk” Has Risen!
Short-term swings in the stock market have certainly been much more frequent and dramatic in recent years. Events similar to the “Flash Crash” of 2010 seem almost commonplace particularly in the last hour of trading days. Last week is a good example of what has become an all too frequent occurrence in the stock market. The S&P 500 ended the week up only about 85 basis points but oscillated during the week by more than 415 basis points!
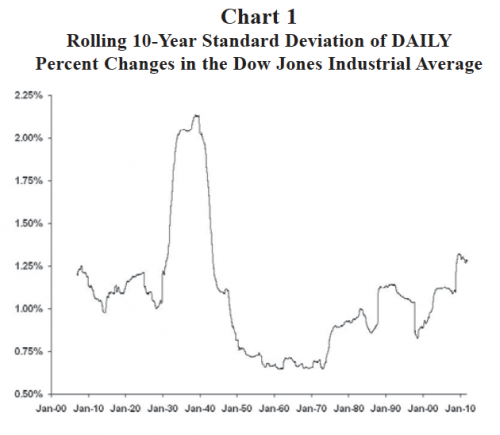
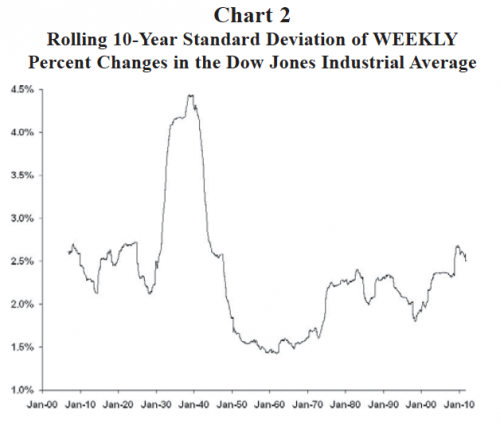
Charts 1 and 2 graphically capture the “trader risk” history of the Dow Jones Industrial Average Stock Price Index. Chart 1 illustrates a rolling 10-year standard deviation of daily percent changes in the stock market while Chart 2 shows the same measure of price volatility for weekly percent changes in the stock market. In the last decade, daily price volatility has risen to about 1.3 percent—its highest level over any trailing 10-year period since the Great Depression era and a risk level which is about double what daily price volatility use to average during the early post-war era between 1950 and the early-1970s! Moreover, current daily price volatility is also more pronounced compared to anytime during the first three decades of the 1900s. Finally, Chart 2 shows that weekly price volatility has similarly been elevated (although not as pronounced as daily price volatility) in the contemporary era.


