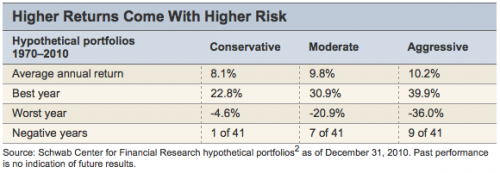
As you can see in the table below, "Higher Returns Come With Higher Risk," since 1970, an aggressive investor would have earned a 10.2% annualized return versus an 8.1% annualized return for a conservative investor. Who wouldn't want the higher return? Well, it depends on the risk you're willing to take to get there. What this table further shows is that the 10.2% return came within a much wider range of annual returns and, most importantly, was generated only through "stick-to-it-iveness."
The aggressive investor had to suffer nine down years, one of which generated a portfolio loss of 36%. Many investors have learned the hard way that their tolerance for a big loss in a year was less than they thought. And to maintain that aggressive allocation, you generally have to rebalance in favor of the asset class(es) that generated those steep losses and away from those asset classes that had weathered the storm.
We believe that rebalancing to maintain an aggressive allocation is the best way to generate the higher return. That, of course, is the real test—a test that is administered more often during times of increased volatility. Here's a practical way to think about rebalancing: Your portfolio will tell you when it's time to trim from or add to an asset class. You don't need to rely on anyone's forecast of what may or may not happen.
Now let's take the conservative investor. Your average annual return after 41 years is just 8.1%, but you only had to suffer one losing year, even though your best year paled in comparison to the aggressive investor's best year. For some, it's worth the lower return for the sleep-at-night benefits.
Market timing: a dangerous game
It's enticing to try to "catch" the next big investment wave (up or down) and allocate assets accordingly. But there are very few time-tested tools for consistently making those decisions well. Unfortunately, rearview mirror investing (or performance chasing) never seems to go out of style.
We did an interesting historical study of investor behavior. In the chart below, you can see the difference between mutual fund returns and investor returns in those same funds.
The fund return represents the official time-weighted return as reported by the funds themselves. It does not consider the effect of deposits and withdrawals. We measured the performance that would have been earned by an investor who bought at the start of a period and held all the way to the end.
The investor return represents the dollar-weighted return as calculated by Morningstar. It measures the performance of all dollars invested in the funds, including the timing of deposits and withdrawals. As such, it captures a truer picture of what investors actually earn on the dollar in aggregate.
Many investors think they can do better by waiting until the next "perfect" time to buy or sell. Their track record tells us they are generally wrong. Investors tend to pile in after a fund gets hot and then sell or stop investing after the fund has gone cold or the market has dropped significantly.
The gap between fund return and investor return measures how much worse investors did by moving in and out of funds than they would have with a buy-and-hold strategy. The gap for the recent 10-year period is 1.5% per year, totaling a cumulative 23.4%. Investors gave up nearly a third of the total cumulative return due to poor timing.
Although the chart is as of December 31, 2010, we looked at other 10-year periods, as well. The average investor consistently earned less than the average fund.
Decent Fund Returns … Lower Investor Returns

Source: Schwab Center for Financial Research with data from Morningstar, Inc., as of December 31, 2010. Fund return is the weighted average time-weighted return of all active funds in the Morningstar domestic equity, specialty, and international stock categories. Each fund is represented by its oldest share class. Investor return for each fund is calculated by Morningstar and reflects the average return on all dollars invested based on estimated monthly net fund flows. The aggregate investor return and fund return are averages weighted by the size of each fund. Only funds with both the fund return and the investor return are included in the analysis. Past performance is no indication of future results.


