It's Not Too Much Debt, It's Too Little Labor Force
…And…
It's Not a New-Normal, It's an OLD-Normal
by James Paulsen, Wells Capital, Wells Fargo
May 4, 2011
Last week's initial estimate of first quarter real GDP growth of 1.8 percent strengthened the widely held view this is a "new-normal" recovery. Through the first seven quarters of the current recovery, annualized real GDP growth has been 2.8 percent—far slower compared to any recovery between 1960 and 1985. Most contend this slower recovery growth rate reflects special structural headwinds characterizing the current recovery including that households are deleveraging, raising savings, and avoiding normal risk behaviors.
Although the contemporary recovery growth rate is slower than those prior to 1985, it is very similar to the last two recoveries (i.e., the early 1990s and early 2000s) which also produced subpar recovery growth rates. So while weaker recoveries may be a new-normal, it is a "new" normal which is at least 25 years old. Furthermore, do household balance sheets really explain the slower pace of economic growth in the current recovery? The speed and character of the current recovery is very similar to the last two recoveries even though the savings rate was higher and the debt burden was much lower at the beginning of both the 1991 and 2001 recoveries.
In our view, the "new-normal economy" is not a current recovery phenomenon but rather is already a quarter century old. Nor is it primarily the result of high debt burdens, low savings rates, or muted risk-taking behaviors. Rather, slower growing economic recoveries during the last quarter century are predominantly the result of a watershed reduction in the growth of the U.S. labor force which has persisted since the mid-1980s.
This distinction, while not widely recognized, is important. Would the Federal Reserve maintain a near zero short-term interest rate and would they have undertaken QE2 if they believed weak U.S. labor force growth rather than weak balance sheets was the primary culprit behind the sluggish contemporary recovery? Would investors be so concerned about "risk-on" exposures if, rather than being convinced the current recovery faces unprecedented headwinds and is simply not working, they perceived the contemporary recovery was unfolding very "normally" compared to how recoveries have progressed in the last quarter century?
Economic Recoveries in the Last 50 Years
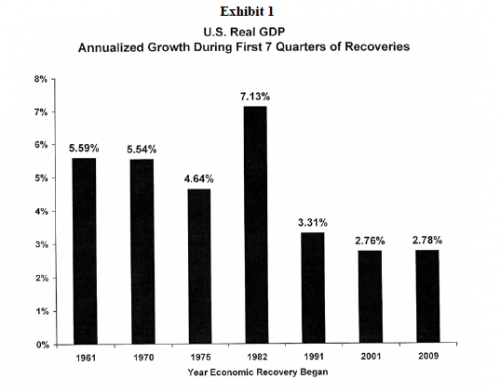
Exhibit 1 illustrates the annualized growth rate during the first seven quarters of every recovery since 1960. Compared to earlier times, the last three recoveries have clearly been disappointingly slower. Between 1960 and the mid-1980s, the annualized first seven quarter growth rate in real GDP was between 4.5 percent and slightly more than 7 percent. By contrast, in the last three recoveries, annualized growth has hovered in a tight range between 2.7 and 3.3 percent.
Rather than suggest the current recovery is a new-normal, Exhibit 1 illustrates the pace of growth in this recovery so far is very similar to the last two recoveries. Each of the last three recoveries have exhibited much slower, new-normal-like growth compared to those occurring before the mid-1980s. So, whatever caused this new-normal slower economic growth has been doing so for the last 25 years! This is not a "new" new-normal. "Bold calls" suggesting the U.S. economy is headed for a prolonged period of slower growth are simply describing a trend already evident for a quarter century. Moreover, contemporary problems with overleveraged balance sheets and a low savings rate hardly seem an adequate explanation. For example, why would the current state of U.S. household balance sheets explain why economic growth during the 1991 and 2001 recoveries was persistently weaker than previous post-war recoveries?
U.S. Economic Speed Limit Lowered in 1985
Rather than due to damaged balance sheets since the 2008 crisis, the speed of U.S. economic recoveries was significantly lowered by a watershed decline in the growth of the U.S. labor force commencing in the mid-1980s. The rate of underlying resource growth (i.e., land, labor, and capital) has always been "the" most important determinant of economic growth. This has been true throughout history and across economies. Indeed, in recent years, emerging world economic growth has outpaced developed country economic growth mostly because emerging economies have exhibited much faster labor force growth.
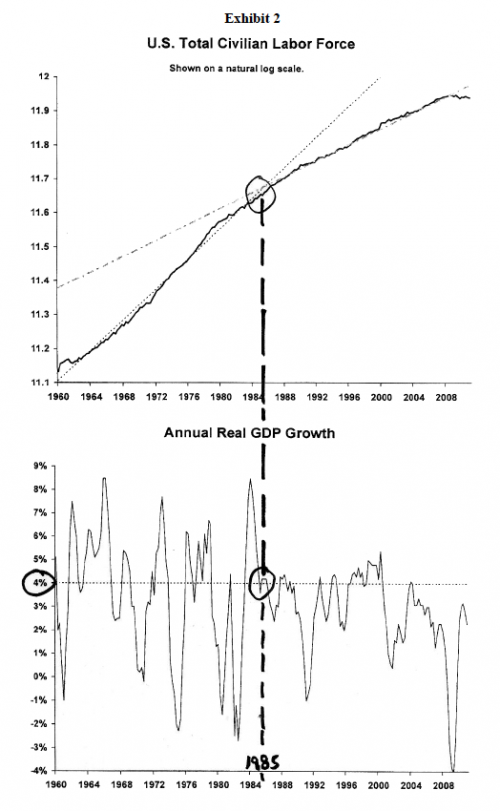
Exhibit 2 compares a chart of the U.S. labor force with the annual rate of real GDP growth since 1960. Prior to the mid-1980s, the U.S. labor force grew at a rapid annualized pace of 2.1 percent whereas since 1985 it has only risen at a 1.1 percent annualized rate. Even more striking, during the 1970s, the U.S. labor force rose at a robust 2.7 percent annualized pace compared to only a 0.6 percent growth rate during the last decade.
Prior to 1985, the U.S. labor force was fueled by baby-boomer demographics and by the steady entrance of women into the workplace. The positive impact of these trends began to wane in 1985 and for the last 25 years has lowered the inherent speed of achievable economic growth. In the 25 years leading up to 1985, annual real GDP growth exceeded 4 percent more than one half the time, whereas since, it has surpassed a 4 percent annual growth rate only about one-quarter of the time. Moreover, prior to 1985, annual "year-on-year" growth often reached levels between 5 and 8 percent. Since 1985, it has only marginally exceeded a 5 percent growth rate in only two out of 103 rolling four-quarter periods!
While the last three economic recoveries have been slower, this is not due solely to balance sheet problems as many suggest. Rather, economic recoveries have been slower in the last 25 years primarily because the U.S. no longer possesses rapid resource growth as it did in earlier decades. As Exhibit 2 illustrates, the U.S. economic speed limit has been effectively reduced to about 4 percent. The new-normal, which so many believe the U.S. is headed toward, is actually a description of where this country has been for more than a quarter century. As has been the case for the last 25 years, the fastest annual real GDP growth likely to be achieved in this recovery will not be much more than 4 percent. In this light, so far in this recovery, the combination of almost 3 percent annualized real GDP growth despite a declining labor force may be a much more successful result than widely appreciated.
Labor-Force Adjusted Real GDP Growth
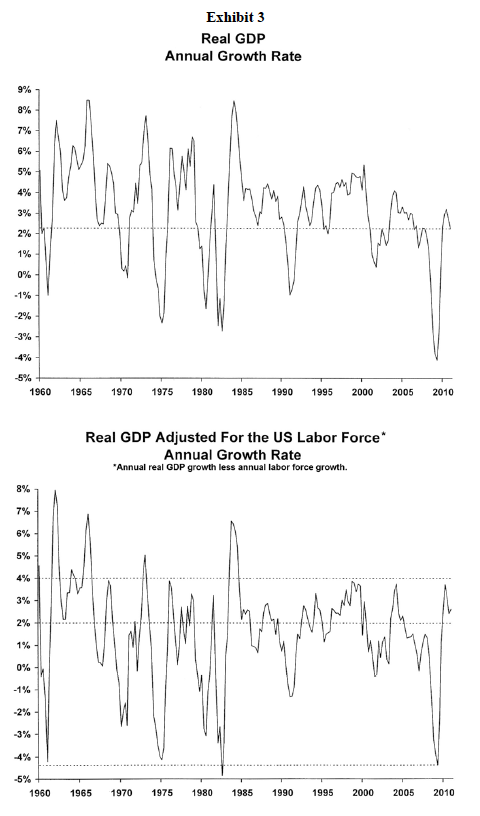
Exhibit 3 compares a chart of annual real GDP growth (top chart) with a chart of annual real GDP growth adjusted by the annual growth of the U.S. labor force. The top chart illustrates the record-setting collapse in real GDP growth during the last recession and also how the current recovery, while on par with the last couple recoveries, is thus far weaker than most since 1960. However, when real GDP growth is adjusted for differences in underlying labor force growth, the last recession and current recovery appear much more "normal" by historical comparison. Adjusted for differences in labor force growth, the depth of the decline in adjusted real GDP growth was no larger in the last recession than it was during recessions in 1960, 1975, and 1982. Moreover, so far the contemporary recovery has produced labor-force adjusted annual real GDP growth of 3 to 4 percent which is not only very similar to the last two recoveries, but to most recoveries since 1960!
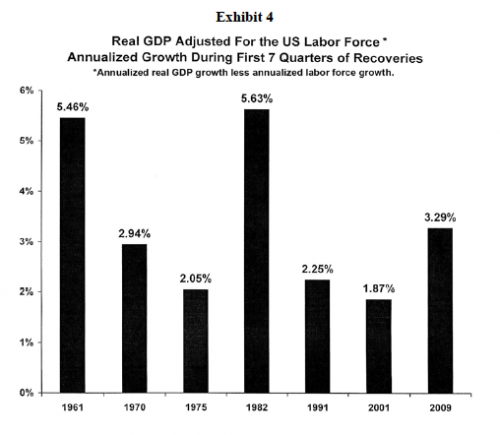
Exhibit 4 directly compares adjusted growth during the first seven quarters of the contemporary recovery with all recoveries since 1960. Labor force adjusted real GDP growth in the current recovery is thus far faster than all but two recoveries since 1960! Indeed, so far it is growing significantly faster than either of the previous two recoveries of the last 25 years and is also stronger than either economic recovery during the 1970s. Once differences for the inherent economic growth attributable to demographically-driven labor force trends are accounted for, the contemporary recovery appears very "normal."
Implications?
Aging U.S. demographics and sluggish labor force growth have been dominating the character of economic recoveries for more than a quarter century. This "old" new-normal has several implications.
Recovery is Working
A consensus believes, because of deleveraging problems, the U.S. economic recovery simply isn't working. This perception explains why, despite nearly two years of almost 2.8 percent annualized economic growth, the U.S. Federal Reserve believes it must continue to inject liquidity and keep short-term interest rates near zero. It also explains why after almost a doubling of stock prices, many investors still seem content with zero-return money market funds. However, despite this popular perception, the contemporary economic cycle is not broken, it has not been overwhelmingly altered by debt burdens, and it does not represent a "new" new-normal.
Rather, in the mid-1980s, a downshift in labor force growth reduced the U.S. economic speed limit and "all" recoveries since have proved more sluggish compared to earlier post-war norms. In the current recovery, consumer confidence remains depressed and the job market has been sluggish. But, this also occurred in each of the last two recoveries since 1985. That is, the speed and character of the current recovery does not represent a new-normal but rather is an "oldnormal." Finally, although economic cycles are different than they were earlier in post-war history, there is no need for panic since the current recovery seems to be working normally compared to how recoveries have been unfolding during the last 25 years.
Won't do much better than 4 percent
Many have been disappointed by the sluggish pace of real GDP growth in the current recovery particularly after such a deep recession. However, the lower chart in Exhibit 2 suggest it is unrealistic to expect annual real GDP growth much above 4 percent in this recovery. Why? Because ever since U.S. labor force growth downshifted in the mid-1980s, the maximal pace of real GDP growth has rarely been above 4 percent and has only briefly reached as much as 5 percent.
In a recovery where labor force growth is no longer growing robustly but rather is contracting, real economic growth should not be expected to reach rates achieved regularly prior to the mid-1980s. The Federal Reserve can keep injecting liquidity and maintain a zero interest rate policy forever, but as suggested by Exhibit 2, neither will raise the contemporary recovery growth rate much above 4 percent unless somehow monetary policy magically improves U.S. immigration growth.
Given how deep the last recession was, why hasn't the current recovery at least been stronger than the last two recoveries which experienced shallower recessions? As illustrated by Exhibit 4, when adjusted for differences in underlying labor force growth, so far the current recovery has been much stronger than the last two recoveries. Indeed, it is the third strongest since 1960!
There will likely continue to be widespread disappointment in the pace of growth during this recovery. But are current consensus growth expectations (based on old historic norms when the economy was significantly boosted by solid labor force growth) really realistic? Should the nation be shocked and panicky about annualized real GDP growth of almost 3 percent so far in this recovery when the best it will likely do is about 4 percent? Should so many simply assume something must be amiss or broken in the economy since the recovery isn't growing as fast as it did prior to 1985? Or, should there be broader recognition that the speed of economic growth has been significantly lowered during the last 25 years by an identifiable source (labor force growth) and when consideration is given to this change, the current recovery is progressing quite normally?
Recoveries can still be satisfactory.
Does the lowered speed limit of the U.S. recovery imply the U.S. economy is headed for a prolonged period of economic malaise? Since U.S. labor force growth downshifted in 1985, the U.S. economy has experienced some good economic times. In the last half of the 1980s, during the prolonged 1990s recovery and even during the 2000s recovery, massive profits were generated, jobs were created, consumer spending was robust, and stock prices rose. For example, during the 1990s recovery, even though real GDP growth only averaged about 3.5 percent and annual growth rarely reached above 5 percent, that recovery produced the greatest period of technological change in U.S. history and will long be remembered as a "Boom"! For as long as U.S. labor force growth remains sluggish, the economy's maximal speed limit may be reduced, but economic recoveries may still prove satisfactory.
Importance of Emerging World Economies
Over much of the last couple decades, the U.S. has implemented an economic stimulus program we coined the "Emerging Market Marshall Plan." This stimulus program, aimed at transforming small insignificant economies into self-sufficient capitalist contributors, was not planned by anyone but rather was the result of laissez-faire actions.
Chronic U.S. trade deficits have amounted to billions of U.S. dollar stimulus chronically spent on small emerging economies like China, India, and Mexico. This unplanned but yet successful fiscal-like economic policy proved to be incredibly expensive (e.g., since spending persistently grew faster than incomes, the U.S. household sector destroyed its savings and massively overleveraged its balance sheet). However, after years of chronic trade deficit stimulus, the U.S. has finally taught these previously no-name economies about greed!
Essentially, although nobody was in charge of this policy (except perhaps Adam Smith), running chronic trade deficits for many years, through serendipity, has produced a possible replacement for U.S. aging demographics and slower labor force growth. Today, the result of the Emerging Market Marshall Plan is a newly produced emerging world consumer! A force for future global growth comprised by younger demographics, higher savings, lower debt, and greater desires than exist here in the U.S.
The U.S. may no longer have sufficient labor force growth to maintain world leadership-class economic growth. But it may have created a process by which it can subsidize slower labor force growth via improvements in net exports from emerging world economies. Could the 4 percent real GDP growth U.S. speed limit, in force during the last quarter century, be raised in the years ahead to 4.5 percent or 5 percent because of improving U.S. trade results with emerging world economies?
Inflationary Implications
The escalation of inflationary pressures ended in the early 1980s and ever since disinflation has dominated. The decline in the economic speed limit since the mid-1980s (due to slower labor force growth) has probably represented the most important disinflationary force during the last 25 years and it will likely remain a dominant disinflationary force in the years ahead. There are reasons to be concerned about inflation including the extraordinary accommodative monetary, fiscal, and U.S. dollar policies employed in the last few years. However, policy officials and investors should be careful using earlier post-war relationships (i.e., prior to 1985) to judge inflation risks. The lowered economic speed limit during the last 25 years is perhaps "the" most powerful domestic disinflationary force and it should be appropriately considered alongside rising inflationary fears.
Bad Balance Sheets or Ellis Island
Conventional wisdom believes the economy cannot grow at a satisfactory rate until balance sheets are restored, savings are replenished, and bad debts are written-off or foreclosed. For this reason, most U.S. leaders and policy officials remain in a highly accommodative mode hoping to address these financial issues and allow the economy to return to "old form."
Certainly balance sheets are problematic in this recovery as they have been in other recoveries. But even if debt woes are significantly improved, the pace of real GDP growth is not likely to surge above 5 percent as it did prior to 1985. There simply is not enough recognition given to the impact of sluggish labor force growth even though it has been evident for the last quarter century.
Should policy officials continue to be primarily focused only on financial problems? Do they really need to keep easing until real GDP growth reaches levels between 5 and 8 percent? Or, should the national discourse also be expanded to include more regular discussions about sluggish labor force growth, immigration policies, U.S. exchange rate policies, and emerging world trade policies? Simply put, is the future fate of the U.S. economy more importantly tied to repairing balance sheets or to whether the U.S. reopens Ellis Island?
Summary
The last three economic recoveries have proved much slower than those prior to 1985. The current recovery is widely characterized as a unique "new-normal" recovery, stuck in a slow gear due to once-in-a-lifetime balance sheet issues. The reality, however, is recoveries have been subpar for a quarter century due mainly to a watershed decline in labor force growth. That is, the contemporary recovery is not as much about too much debt, as it is about too little labor force and this recovery is not a new-normal but rather an "old"-normal.
Finally, the current recovery is widely perceived as disappointing and constantly surrounded by fears that efforts to revive the economy simply are not working. However, the character and speed of the contemporary recovery are very similar to the last two U.S. recoveries since the mid-1980s. Furthermore, when adjusted for differences in underlying labor force growth, the current recovery is the third fastest growing recovery since 1960! So far, this recovery has produced annualized real GDP growth just shy of 3 percent. While this certainly is not robust, when consideration is given to the impact of a secular decline in labor force growth, the contemporary recovery may be doing much better than widely perceived.
Copyright © Wells Capital


