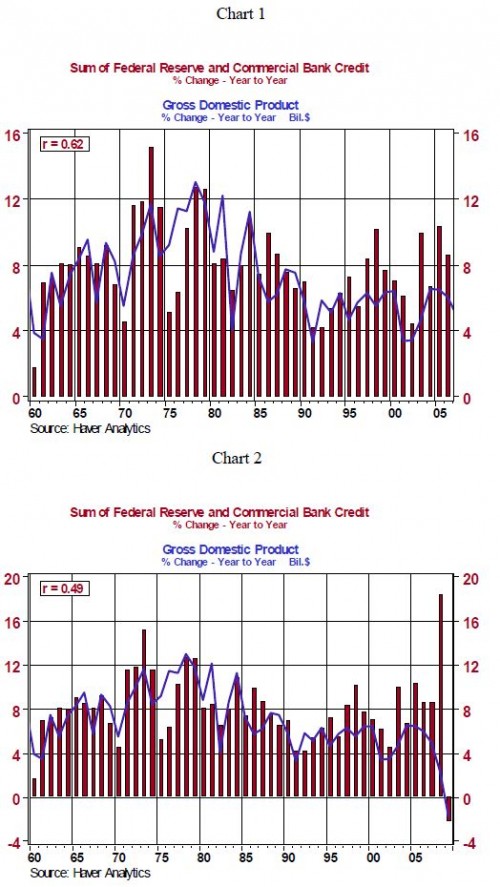
To reiterate, the logic or theory of quantitative (we have stopped italicizing it now) easing is that an increase in the quantity of combined central bank and commercial banking system credit will lead to an increase in nominal aggregate spending on goods, services and assets. Chart 1 shows that the correlation coefficient between percentage changes in the annual average of combined Federal Reserve and commercial banking system credit and the percentage changes in nominal U.S. GDP from 1960 through 2006 is relatively high at 0.62. (A perfect correlation between the two series would be represented by a correlation coefficient of 1.00). Chart 2 demonstrates that this correlation coefficient is reduced to 0.49 when the period is extended through 2009. In 2008, there was a large percentage increase in combined Federal Reserve and commercial banking system credit but a reduction in the percentage change in nominal GDP. We believe that a significant amount of this increased Fed-commercial bank credit was acquired to build up “cash” holdings for precautionary reasons due to the turmoil in the financial markets.
Now, let us examine what happened to combined Federal Reserve and commercial banking system during the Fed’s first round of quantitative easing that covered the 16 months ended March 2010. Chart 3 shows the net change in total Federal Reserve credit, Federal Reserve outright holdings of securities and Federal Reserve credit excluding outright holdings of securities in the 16 months ended March 2010 (the shaded area in the chart). Notice that although Federal Reserve outright holdings of securities increased a net $1.5 trillion during the first round of Fed quantitative easing, total Federal Reserve credit increased by only a net $200 billion during this period because other elements of Federal Reserve credit contracted by a net $1.3 trillion. Chart 4 shows that commercial banking system credit contracted by a net $875 billion in the 16 months of the Fed’s first round of quantitative easing. Thus, when we sum the net change in Federal Reserve credit and commercial banking system credit in the 16 months ended March 2010, the period encompassing the Fed’s first round of quantitative easing, we find that the net change in credit was minus $675 billion. Is it any wonder, then, why the response of nominal GDP growth was so restrained to QE1? We would argue that QE1 was a misnomer in that there was no quantitative easing, but rather a quantitative contraction.


