Stock/Bond Correlation and Economic Policy!?!?
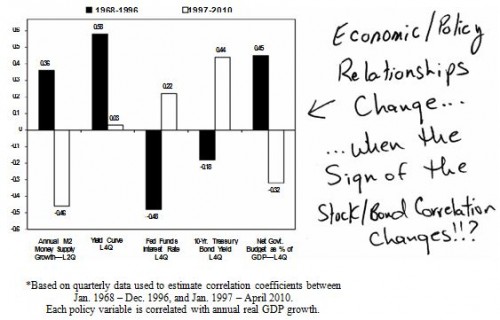
Exhibit 2 compares the efficacy of economic policies when the stock/bond correlation was mostly negative (pre-1997) to when it has been mostly positive (post-1996). The relationships between various economic policies and future real GDP growth (as implied by correlation coefficients) have undergone drastic change since 1997 once the stock/bond correlation turned positive.
Exhibit 2
Correlation Coefficients Between Annual Real GDP
Growth and Economic Policy Variables*
Pre-1997 vs. Post-1997

For example, between 1968 and 1996, when the stock/bond correlation was mostly negative, the correlation between the annual M2 money supply growth rate and the two-quarter lagged annual real GDP growth rate was +0.3 6. That is, faster monetary growth typically produced stronger real GDP growth two quarters later. Conversely, since 1997, when the relationship between stocks and bonds changed, the correlation between money supply growth and real GDP growth has been negative!
Other policy variables show a similar GDP relationship breakdown during the pre- and post-1996 eras. Until 1997, yield-curve movements were strongly positively correlated with lagged real GDP growth rates, but since 1997, this relationship has essentially been independent (i.e., their correlation coefficient has been close to zero). Moreover, until 1997, changes in the Fed funds interest rate or the 10-year Treasury bond yield, were negatively correlated with the four-quarter lagged growth rate in real GDP. However, since 1997, their relationship to future real GDP growth has changed sign. Similarly, the correlation coefficient between changes in net fiscal spending growth and the lagged growth rate in the economy has also changed sign since 1996.
Policy officials need to consider more than just the level of and changes in generalized inflation expectations. They also need to focus on whether the dominant “fear” in the financial markets is inflation or deflation and whether this focused-fear is about to change. Ultimately, the magnitude and directional impact of economic policies may depend as much on whether the stock/bond correlation is above or below zero as it does on whether inflation expectations are rising or falling.
Stock/Bond Correlation and the Stock Market?!?!
The impact of interest rate changes on the stock market has also changed dramatically since 1997. Based on a simple linear regression analysis, Exhibit 3 shows the estimated impact of a 100-basis point change in the ten-year government bond yield on the percent change in the stock market. Between 1968 and 1996, when the stock/bond correlation was mostly negative, a one percent increase in the ten-year bond yield resulted in about a 3.5 percent decline in stock prices. Since 1997, however, when the stock/bond correlation has usually been positive, a one percent rise in bond yields has resulted in a 5.4 percent rise in the stock market.


