by Eddy Elfenbein, Crossing Wall Street
“If you have trouble imagining a 20% loss in the stock market, you shouldn’t be in stocks.” – Jack Bogle
The streak finally came to an end. [Last] Tuesday, the stock market did something it hadn’t done in the previous 109 trading days. It closed down by more than 1%.
This was the longest such hot streak in more than 20 years, and it was close to becoming the longest in over 50 years. If we look more closely, the recent streak was even more impressive because there were only two days in which the S&P 500 fell more than 0.7%. Of course, we have to remember that not that long ago, a 1% drop was barely a scratch. In 2008, it happened 75 times.
As we know well, Wall Street has a notoriously poor memory.
So, is this the beginning of the end? Have the walls come crashing down? Eh…probably not. Bear in mind that the Trump Rally has endured four North Korean missile launches, two Fed rate hikes, and of course, President Trump himself. Through all that, it’s quietly powered ahead.
But this may be the end of the Trump Trade. It’s a little more complicated than has often been portrayed. I’ll explain what it all means. I’ll also cover some of the recent stories impacting our Buy List stocks. But first, let’s look at the fading Trump Trade.
The Death of the Trump Trade
While there’s been a lot of talk of the Trump Trade, properly speaking, there were two separate trades in recent months.
The first Trump Trade came immediately after the election. That’s when stocks soared. The stock rally was matched by a big downturn for bonds. Within a few days, the yield on the 10-year Treasury jumped from around 1.8% to close to 2.3%. That’s an unusually large move for such a short period of time. Combine that with the fact that the 10-year yield had been creeping higher since the summer, and you can see how dramatically the interest-rate outlook had changed.
Within the stock sectors, the small-caps saw the biggest gains. On November 3, the Thursday before the election, the Russell 2000 stood at 1,156.89 (see below). By November 25, the index had risen to 1,347.20. That’s a jump of more than 16% in just over three weeks. That’s a huge leap for an entire size category.
Among stock sectors, the big winners were Industrials and Financials. The move in the latter was astounding. On our Buy List, shares of Signature Bank (SBNY) soared 21% in four days. Prior to the election, Goldman Sachs warned of dire consequences if Trump were to be elected. That outcome, apparently, didn’t include a massive rally in shares of Goldman. Shares of GS gained more than 60% in the second half of 2016. (The bank’s former COO, Gary Cohn, is now President Trump’s top economic advisor.)
Here’s what was happening. This first stage of the Trump Rally was based on the idea of a markedly improving economy. Traders thought policies in Washington would shift towards fiscal stimulus. That’s why the Cyclicals stocks led the way. The yield curve widened, and defensive areas like Utilities and Staples didn’t fare so well.
But by early December, that stage of the rally had petered out. By December 13, the S&P 500 had reached a near-term peak of 2,271.72. The stock market was pretty flat for a few weeks after that. By Inauguration Day, the S&P 500 closed at 2,271.31.
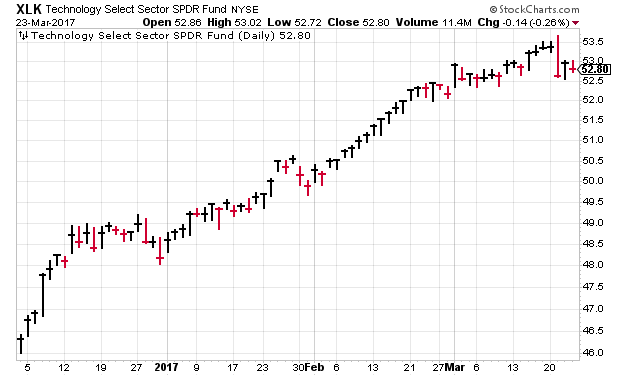
Stage Two of the Trump rally really got going in February. This second stage was led by large-cap tech stocks. Unlike stage one, this time the long end of the bond market was relatively stable. The yield on the 10-year bond peaked around mid-December and has mostly been in a trading range since then (between 2.3 and 2.6%).
Instead, the interest-rate action has been at the short end. The second stage of the Trump Rally happened at the same time there was a perceived need for higher interest rates. This is when we saw yields at the short end of the yield curve touch levels they hadn’t seen in seven or eight years. This move in the market foreshadowed last week’s Fed rate hike. In fact, it also caused traders to think more hikes were on the way.
But now, that thesis is starting to show holes. For one, we can’t help noticing the price of oil. One month ago, West Texas Crude got as high as $54.45 per barrel. Everything was going right for OPEC. The production cuts were holding. Finally! But the latest numbers show that there’s still an oil glut. In fact, it’s a big one, and the oil markets are taking notice. At one point, the price of oil fell ten times in eleven days. This week, West Texas Crude came close to falling below $47 per barrel.
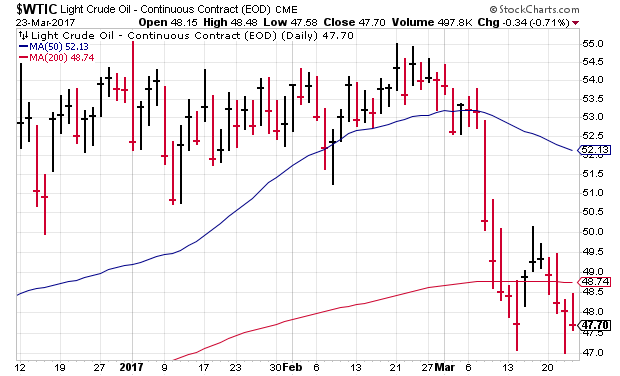
Goldman Sachs noted that OPEC’s production cut has had an unintentional side effect—it has spurred the biggest productions in history. It’s hard to say that the Fed needs to raise interest rates to combat inflation when the price of oil is dropping.
Both parts of the Trump Rally have seen rising share prices and low volatility. If I had to pinpoint a single day when the Trump Rally peaked, it would probably be the day after President Trump’s congressional address. Traders loved the speech. The Dow shot up 300 points the following day.
Since then, however, the market has had a tough time getting its footing, and some cracks are starting to show. For example, 217 stocks in the S&P 500 are currently below their 50-day moving average. The overall index is just 0.72% above its 50-DMA. There are now 171 stocks in the index that are more than 10% below their 52-week high, which is the traditional definition of a market correction. In other words, more than one-third of the index is effectively in a correction already.
On Tuesday, the S&P 500 lost 1.24%. Ryan Detrick notes that the average worst day of the year is three times worse than Tuesday’s loss, which is our current worst day of the year. It wasn’t bad, but it was different from the trend, and that’s what catches our attention. The Nasdaq Composite, actually, hit a new all-time high on Tuesday, which shows the impact of large-cap tech.
So stage one of the Trump Rally (November and December) was about a resurgent economy. Stage two (February) was about taking on more risk due to higher rates.
What to do now: I’m still holding onto my view that stocks are due for a modest pullback. It may have already started, since the S&P 500 has now gone three weeks without making a new high. But let me caution you not to worry. I’m not expecting a major decline.
Make sure that you’re well diversified and look for decent dividends. Microsoft (MSFT), for example, currently yields 2.4%. Cinemark (CNK) yields close to 2.7%. I think there’s a very good chance that we’ll be looking at a lot of bargains in the spring. Now let’s look at some news affecting our Buy List stocks.
Buy List Updates
Sherwin-Williams (SHW) said the acquisition of Valspar will take longer than expected. It doesn’t seem to be a major problem. They have to work through some divestitures. Originally, Sherwin thought the deal would close by April. Now they’re thinking it will be June. Going into the deal, SHW knew they were going to have to sell off some units to appease regulators. They just didn’t know what. Don’t let this news worry you. Sherwin-Williams is doing fine.
HEICO (HEI) announced a 5-for-4 stock split. This means investors will get an extra share for every four they currently own. The share price will be expected to fall about 20%. The semi-annual dividend will stay at nine cents per share, so that’s effectively a 25% increase.
I’m never sure why companies like to do small splits like this. If I had my way, only 2-for-1 splits or higher would be allowed, and the share price needs to be over $100. This will be HEICO’s 15th stock split since 1995. The split is payable on April 18 to shareholders of record as of April 7. Cash will be paid in lieu of fractional shares. If you had invested $100,000 in HEICO in 1990, today it would be worth $18.7 million.
That’s all for now. Next week is the final week of the first quarter. On Thursday, the government will update the Q4 GDP report for a second time. Before that, on Tuesday, we’ll get the report on consumer confidence for March. Then on Friday, we’ll get the reports on personal income and spending for February. Be sure to keep checking the blog for daily updates. I’ll have more market analysis for you in the next issue of CWS Market Review!
– Eddy
Copyright © Crossing Wall Street