What now?
by Jeffrey Saut, Chief Investment Strategist, Raymond James
July 25, 2016
I got an email last week that read, “What do I do now?” I replied, “I don’t know what you mean.” She wrote back, “I didn’t buy the February lows that your model told us to buy and I didn’t buy any of the stocks on your ‘buy list’ the Monday following the Brexit Bashing. So what do I do now?” I told her I continue to think we remain in the same secular bull market that began in March of 2009 and I think it has a lot farther to go. Yes, I know the equity markets get overbought from time to time. Yes, I know there will be pullbacks. Yes, I know certain valuation metrics are historically expensive, but I also know how secular bull markets work. I have written many times about the fact that there are not many of us left. There are not many of us that have seen a secular bull market. I don’t know where the market mantra came from that a 20% rally is a bull market and a 20% decline is a bear market, but I do not believe that’s the case. Well, it might be the case in the shorter term for tactical bull and bear markets, but it’s not the case for secular bull markets!
Secular bull markets tend to last 14 - 15 years and compound at 16% per year (on average). Study the Dow Jones Industrial Average chart (chart 1). Since the 1929 “crash” there has been just two secular bull markets: 1949 to 1966 and 1982 to 2000. Were there pullbacks during those secular “bulls?” You bet there were. The President Kennedy “steel crisis” of 1962 lopped ~26% off of the D-J Industrials in a pretty short time. Then there was the slight accident in October of 1987 that left the Industrials off 22.6% in a single day, but it was not the end of either of those secular bull markets. Again, study the chart. Every time the D-J Industrial Average (INDU/18570.85) has emerged from a multi-year trading range (1933 – 1949, 1966 – 1982, 2000 – 2013) the markets has entered a secular bull market. I don’t think it is any different this time.
So what’s driving this bull market? One of the drivers is that very few believe we are in a secular bull market. This is reflected by the highest cash balances in portfolios since 2001, according to CNBC. This is not the way bull markets end. Sir John Templeton once said, “Bull markets are born on pessimism, grow on skepticism, mature on optimism, and die on euphoria.” Clearly we are nowhere near “optimism” and likely years away from “euphoria.” How about earnings? I have posited, and continue to do so, that the earnings bar was lowered way too much for the 2Q16 (-5.5% y/y) and that earnings were going to come in better than expectations. Well, with 25% of the S&P 500 companies reporting, 68% have beaten their estimates. Moreover, in the back-half of this year, earnings comparisons should look really good because last year’s 3Q and 4Q earnings were really bad.
Speaking to valuations, S&P’s bottom-up, operating earnings estimate for next year is roughly $134 for the S&P 500 (SPX/2175.03). As often stated, if that estimate is anywhere near the mark, at the Brexit low (1991), the SPX was trading at under 15x next year’s estimate. “But Jeff,” one of our financial advisors asked me last week, “the S&P 500 is up 365 points (+20%) from your model’s ‘bottom call,’ so the SPX is now trading at 16.2x next year’s estimate, which is above its historical average.” That’s true, but as stated repeatedly using the Rule of 20s, which suggests the P/E multiple should be whatever the inflation rate is added to the P/E multiple to equal 20, stocks are still not fully valued. In the current case, that P/E multiple would be 18x because the inflation rate is around 2% (18 + 2 = 20). Using Ben Graham’s valuation formula, however, produces an even higher multiple [V = EPS x (8.5 + 2g); where V is the intrinsic value, EPS is the trailing 12-month EPS, 8.5x is the P/E ratio of a stock with 0% growth and g being the growth rate for the next 7 - 10 years].
For those of you that didn’t take the time to read Richard Bernstein’s excellent article imbedded in last Friday’s Morning Tack, I will give you some sound bites. Rich states:
One of the most frustrating statements we hear is that bull markets are impossible without P/E ratios expanding. History shows that this is simply not true (Bernstein). There have been interest rate-driven bull markets during which interest rates fall and P/E multiples expand, but there have also been earnings-driven bull markets during which interest rates rise and P/E multiples contract. At Richard Bernstein Advisors (RBA), our portfolios are positioned for an earnings-driven bull market. . . . Portfolio construction during an earnings-driven market needs to focus on P/E contraction, ensuring that multiples contract by ‘E’ going up rather than by ‘P’ going down. Cyclicals tend to outperform stable growth during earnings-driven markets because cyclical companies’ incremental earnings growth more than offsets the negative effect of rising rates. Stable growth companies, by definition, are stable and have little or no incremental growth. Stable companies’ P/Es usually contract by ‘P’ going down because ‘E’ is stable. RBA thinks the next year or so will be an earnings-driven bull market.
Plainly we agree and for another interesting read, “ping” Capital Economics’ June 7, 2016 fascinating report titled “Causes and Consequences of a Lower U.S. Equity Risk Premium” (Risk Premium).
Circling back to the question of “What do I do now?” Well if you believe my friend Rich, you can buy one of his funds. If you want to be more cautious, you can buy Royce Value Trust (RVT/$12.38), which I own. It trades at ~15% discount to net asset value (NAV) and possess a decent distribution rate (yield). The fund’s focus is on small and micro capitalization stocks. Speaking to that asset class, a few weeks ago I featured another micro-cap fund managed by Michael Corbett who is the CEO, CIO and portfolio manager at the Chicago-based Perritt Capital. The fund is called The Perritt MicroCap Opportunities Fund (PRCGX/$33.42). As previously stated, I think the small/micro-capitalization universe is going to do well going forward and would tilt portfolios accordingly.
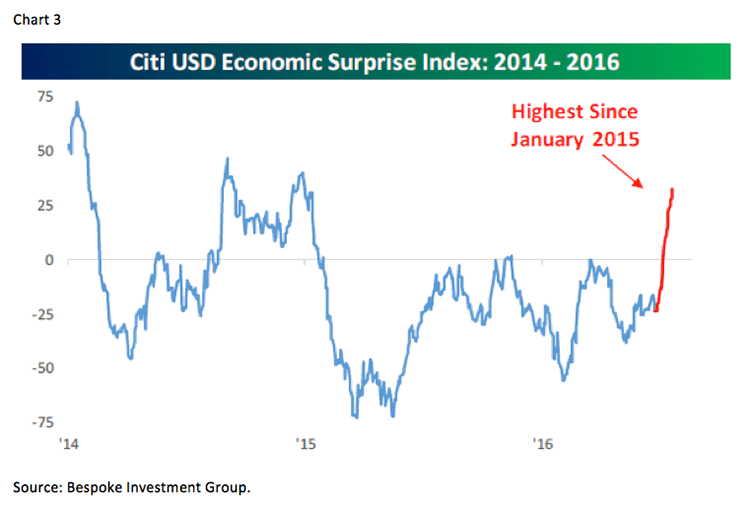
The call for this week: Winston Churchill once said, “If we open a quarrel between the present and the past, we shall be in danger of losing the future.” That seems to be the appropriate quote for the stock market currently. Too many pundits continue to focus on the past – the range-bound market for the past nearly two years – or the present – valuations are too high – despite the message of the market. That message is – we have broken out to the upside of a two-year consolidation – that produces a technical price target for the S&P 500 of over 2300. Meanwhile, the Wilshire 5000 (the broadest index) has tagged a new all-time high, both the NYSE Advance/Decline Line and the Operating Companies Only A/D Line (eliminates interest sensitive funds/ETFs, etc.) have traveled to new highs, new highs over new lows are expanding, earnings and economic data are coming in better than expected (chart 3), and the list goes on. All of that caused one savvy seer to pen an article titled “Did the S&P 500 Just Enter a New Bull Market?” He states, “The S&P 500 is officially up more than 20% from the February lows. This raises another question: Did a new bull market just start?” There’s that 20% mantra again. The line in his report that leaped out at me read like this, “What makes the recent 20% bounce special is that it took place in just over five months (110 trading days to be exact) and that is much rarer.” Indeed folks, manage money for the environment that you are in, not the one you wish you were in . . .
Copyright © Raymond James


