by Don Vialoux, Timingthemarket.ca
Economic News This Week
July Personal Income to be released at 8:30 AM EDT on Monday is expected to increase 0.4% versus a gain of 0.2% in June. July Personal Spending is expected to increase 0.3% versus a gain of 0.4% in June.
June Case/Shiller20 City Home Price Index to be released at 9:00 AM EDT on Tuesday is expected to slip to a year-over-year gain of 5.1% from a gain of 5.2% in May.
August Consumer Confidence to be released at 10:00 AM EDT on Tuesday is expected to slip to 97.0 from 97.3 in July.
August ADP Private Employment to be released at 8:15 AM EDT on Wednesday is expected to slip to 170,000 from 179,000 in July.
August Chicago PMI to be released at 8:30 AM EDT on Wednesday is expected to ease to 54.5 from 55.8 in July.
Weekly Jobless Claims to be released at 8:30 AM EDT on Thursday are expected to increase ot 265,000 from 261,000 last week.
Revised Second Quarter Productivity to be released at 8:30 AM EDT on Thursday is expected to decline 0.6% versus a previous estimate of a decline of 0.5%.
July Construction Spending to be released at 10:00 AM EDT on Thursday is expected to increase 0.6% versus a decline of 0.6% in June.
August ISM to be released at 10:00 AM EDT on Thursday is expected to slip to 52.2 from 52.6 in July
August Non-farm Payrolls to be released at 8:30 AM EDT on Friday are expected to drop to 180,000 from 255,000 in July. August Private Non-farm Payrolls are expected to fall to 175,000 from 217,000 in July. August Unemployment Rate is expected to slip to 4.8% from 4.9% in July. August Hourly Earnings are expected to increase 0.2% versus a gain of 0.3% in July
July Trade Deficit to be released at 8:30 AM EDT on Friday is expected to dip to $43.0 billion from $44.5 billion in June.
July Factory Orders to be released at 10:00 AM EDT on Friday are expected to increase 2.0% versus a decline of 1.5% in June.
Earnings News This Week
The Bottom Line
Technical, seasonal and fundamental factors point to start of an intermediate correction by equity markets and economic sensitive sectors this month and into September. Traders and seasonal investors should respond accordingly.
Observations
Responses to Federal Reserve spokesmen comments on Friday were significant. Markets interpreted the news as “September remains on the table for another increase in the Fed Fund rate”. Accordingly, the U.S. Dollar Index moved higher, bond prices moved lower and volatility increased.
Short term (e.g. daily momentum indicators) and medium term (e.g. 50 day moving averages for S&P 500 and TSX Composite stocks) technical indicators are trending down.
Economic news this week focuses on the August ISM Index on Thursday and August Employment report on Friday. Both are expected to show diminished U.S. economic growth.
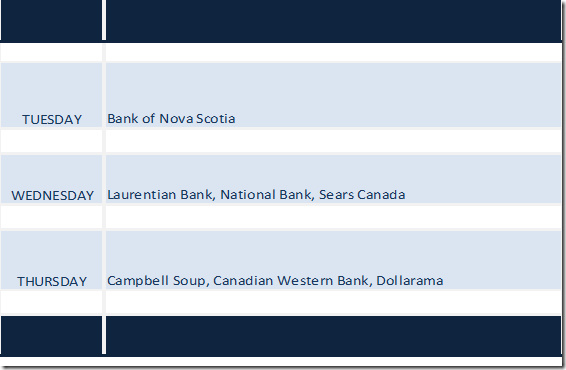
Earnings news this week is quiet. Focus is on Canadian banks.
Second quarter results by S&P 500 companies are winding down: 98% of companies have reported to date. Blended earnings were down 3.2% on a year-over-year basis. 71% of reporting companies reported greater than consensus earnings and 53% reported greater than consensus second quarter revenues. When second quarter reports were released, 77 companies issued negative third quarter guidance and 33 companies issued positive guidance.
International focus at the end of this week is on the G20 meeting in China. Focus is on currency volatility.
Seasonal influences on a wide variety of equity markets, commodities and sectors historically change to negative in the month of September. The exception is natural gas, which turns positive.
Technical action by individual S&P 500 stocks was mixed last week: 20 stocks broke intermediate resistance and 18 stocks broke intermediate support. Notable on the list stocks breaking resistance were Financial stocks. Notable on the list of stocks breaking support were health care stocks. 316 stocks are in intermediate uptrends (down 13 from last week), 62 stocks are in neutral trends (up 6 from last week) and 132 stocks are in downtrends (up 7 from last week).
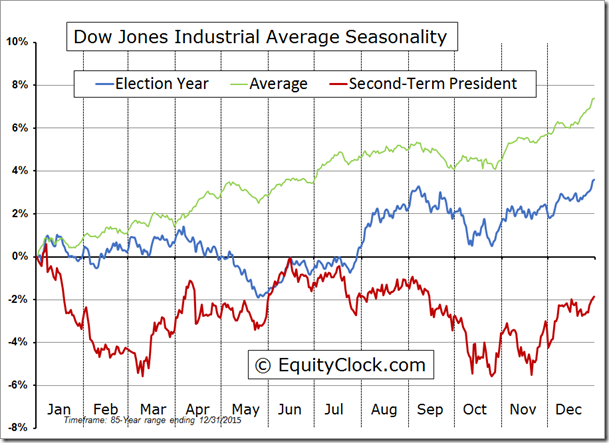
U.S. equity markets have a history of moving lower from near the end of August until late October during U.S. Presidential Election years when a new President is elected following a two term President
Equity Indices and Related ETFs
Daily Seasonal/Technical Equity Trends for August 26th 2016
Green: Increase from previous day
Red: Decrease from previous day
Calculating Technical Scores
Technical scores are calculated as follows:
Intermediate Uptrend based on at least 20 trading days: Score 2
Higher highs and higher lows
Intermediate Neutral trend: Score 0
Not up or down
Intermediate Downtrend: Score -2
Lower highs and lower lows
Outperformance relative to the S&P 500 Index: Score: 2
Neutral Performance relative to the S&P 500 Index: 0
Underperformance relative to the S&P 500 Index: Score -2
Above 20 day moving average: Score 1
At 20 day moving average: Score: 0
Below 20 day moving average: –1
Up trending momentum indicators (Daily Stochastics, RSI and MACD): 1
Mixed momentum indicators: 0
Down trending momentum indicators: –1
Technical scores range from -6 to +6. Technical buy signals based on the above guidelines start when a security advances to at least 0.0, but preferably 2.0 or higher. Technical sell/short signals start when a security descends to 0, but preferably -2.0 or lower.
Long positions require maintaining a technical score of -2.0 or higher. Conversely, a short position requires maintaining a technical score of +2.0 or lower
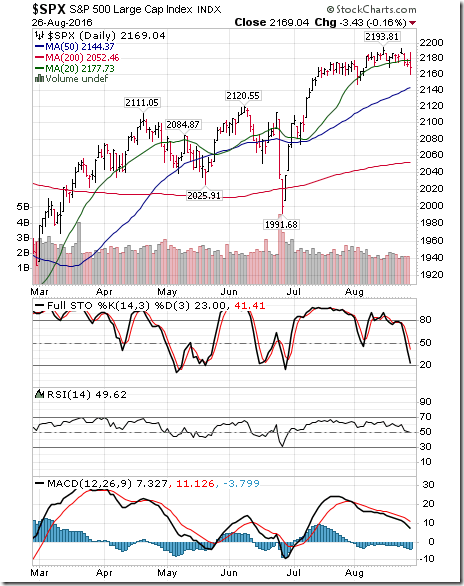
The S&P 500 Index dropped 14.83 points (0.68%) last week. Intermediate trend remains up. The Index dropped below its 20 day moving average. Short term momentum indicators are trending down.
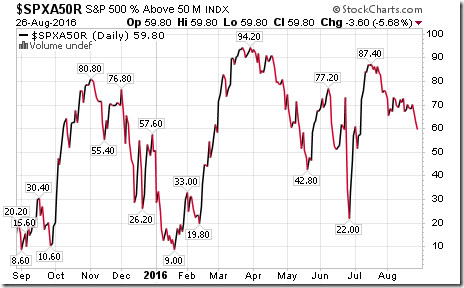
Percent of S&P 500 stocks trading above their 50 day moving average (also known as the S&P 500 Momentum Barometer) dropped last week to 59.80% from 68.60%. Percent remains intermediate overbought and trending down.
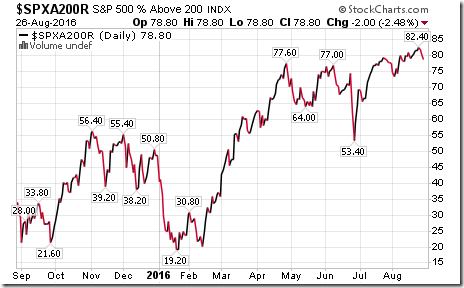
Percent of S&P 500 stocks trading above their 200 day moving average dropped last week to 78.80% from 81.60%. Percent remains intermediate overbought and showing early signs of rolling over.
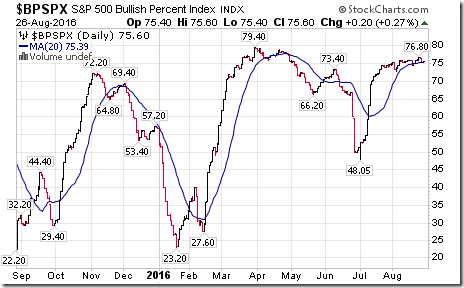
Bullish Percent Index for S&P 500 stocks slipped last week to 75.60% from 76.00%, but remained above its 20 day moving average. The Index remains intermediate overbought.
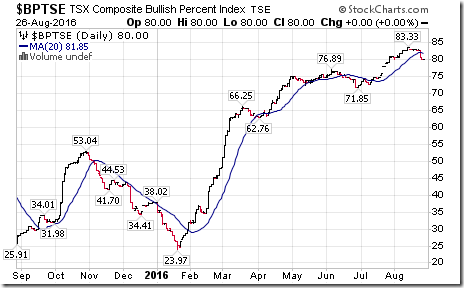
Bullish Percent Index for TSX Composite stocks dropped last week to 80.00% from 82.92% and dropped below its 20 day moving average. The Index remains intermediate overbought and trending down.
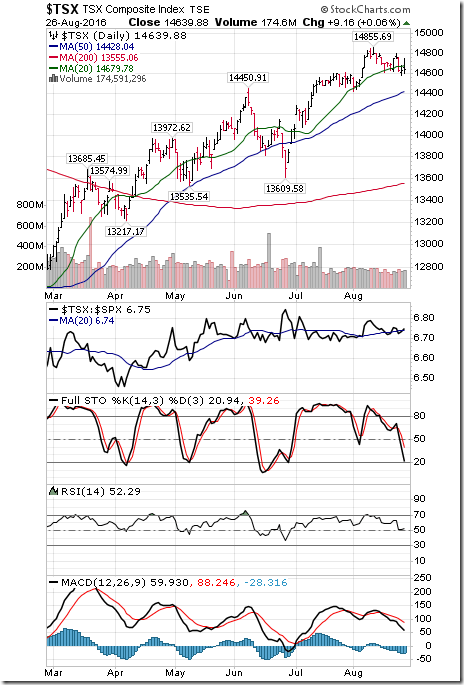
The TSX Composite Index dropped 47.58 points (0.32%) last week. Intermediate trend remains up (Score: 2). Strength relative to the S&P 500 Index remained neutral (Score: 0). The Index dropped below its 20 day moving average (Score: -1). Short term momentum indicators are trending down (Score: -1). Technical score dropped last week to 0 from 2.
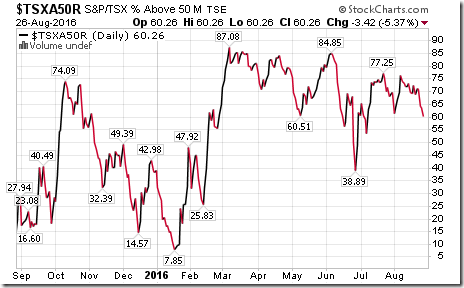
Percent of TSX stocks trading above their 50 day moving average (also known as the TSX Composite Momentum Barometer) plunged last week to 60.26% from 82.92%. Percent remains intermediate overbought and trending down.
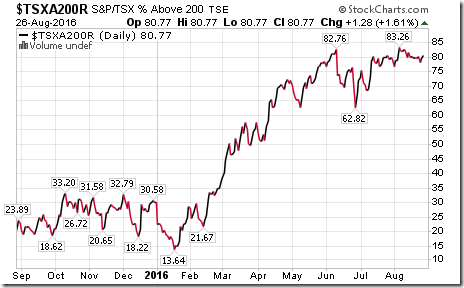
Percent of TSX stocks trading above their 200 day moving average slipped last week to 80.77% from 82.92%. Percent remains intermediate overbought and trending down.
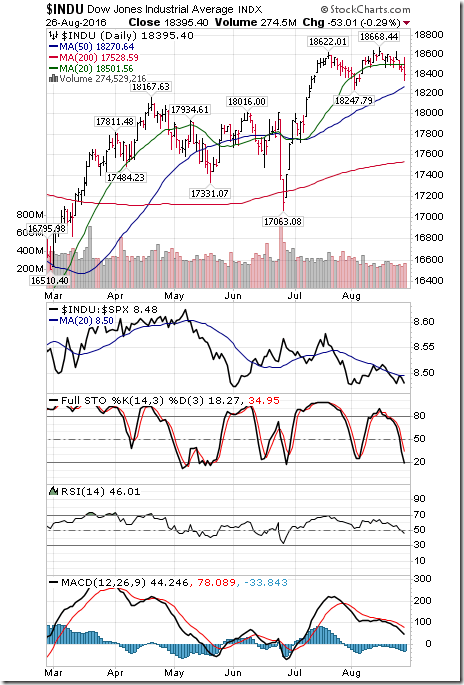
The Dow Jones Industrial Average dropped 157.17 points (0.85%) last week. Intermediate trend remains up. Strength relative to the S&P 500 Index remained neutral. The Average dropped below its 20 day moving average. Short term momentum indicators are trending down. Technical score slipped to 0 from 2 last week.
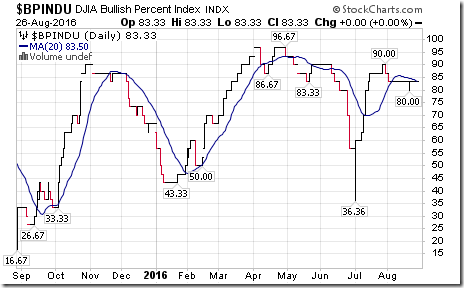
Bullish Percent Index for Dow Jones Industrial Average stocks was unchanged last week at 83.33% and remained below its 20 day moving average. The Index remains intermediate overbought.
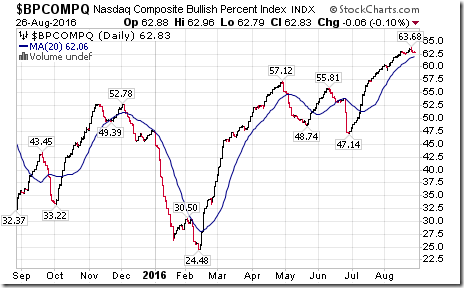
Bullish Percent Index for NASDAQ Composite stocks slipped last week to 62.83% from 62.85% and remained above its 20 day moving average. The Index remains intermediate overbought.
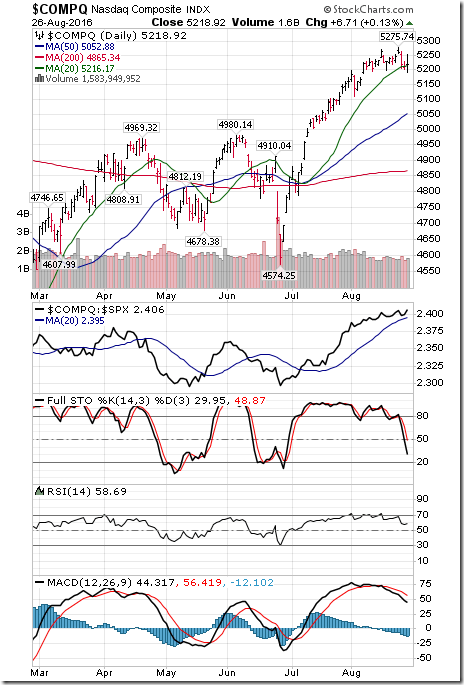
The NASDAQ Composite Index dropped 19.46 points (0.37%) last week. Intermediate trend remains up. Strength relative to the S&P 500 Index remains up. The Index recovered on Friday to above its 20 day moving average. Short term momentum indicators are trending down. Technical score remained last week at 4.
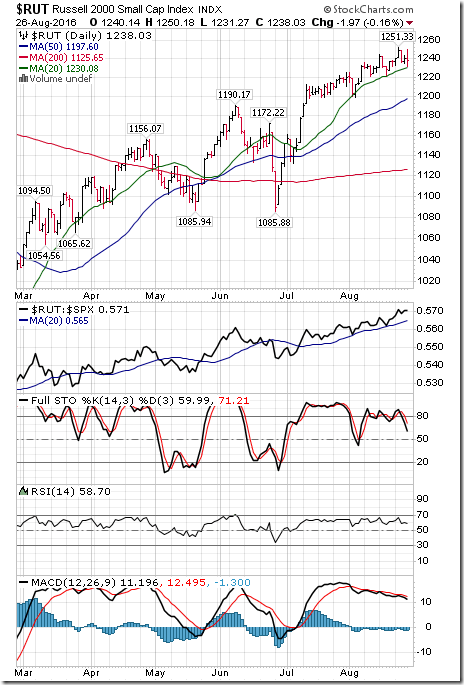
The Russell 2000 Index added 1.26 points (0.10%) last week. Intermediate trend remains up. Strength relative to the S&P 500 Index remains positive. The Index remains above its 20 day moving average. Short term momentum indicators are trending down. Technical score remained at 4.
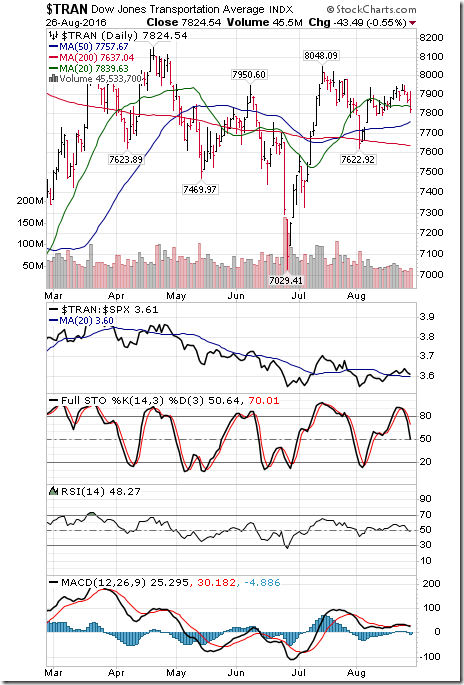
The Dow Jones Transportation Average dropped 105.81 points (1.33%) last week. Intermediate trend remains neutral. The Average dropped below its 20 day moving average on Friday. Strength relative to the S&P 500 Index remains neutral. Short term momentum indicators are trending down. Technical score slipped last week to -2 from 2.
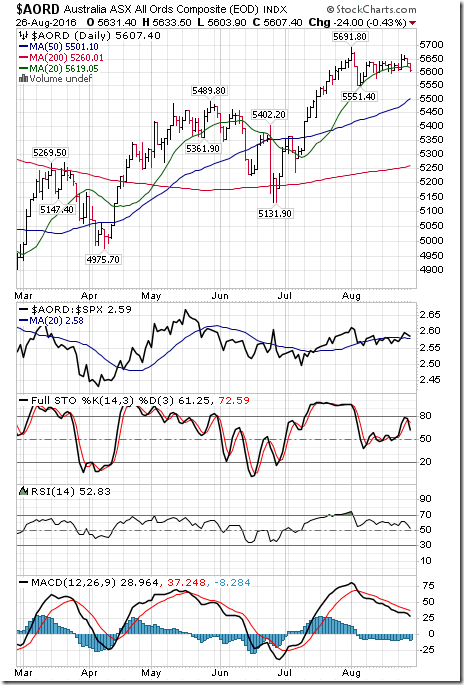
The Australia All Ordinaries Composite Index dropped 18.00 points (0.32%) last week. Intermediate trend remains up. Strength relative to the S&P 500 Index remains neutral. The Index dropped below its 20 day moving average on Friday. Short term momentum indicators are trending down. Technical score dropped last week to 0 from 2.
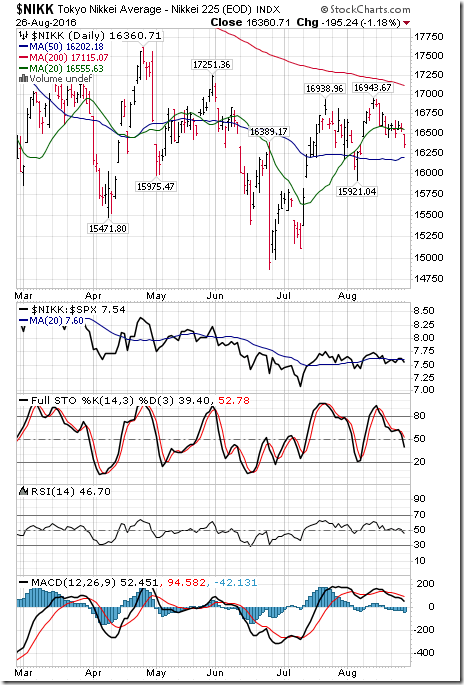
The Nikkei Average dropped 185.11 points (1.12%) last week. Intermediate trend remains down. Strength relative to the S&P 500 Index remains neutral. The Average dropped below its 20 day moving average. Short term momentum indicators are trending down. Technical score remained last week at -4.
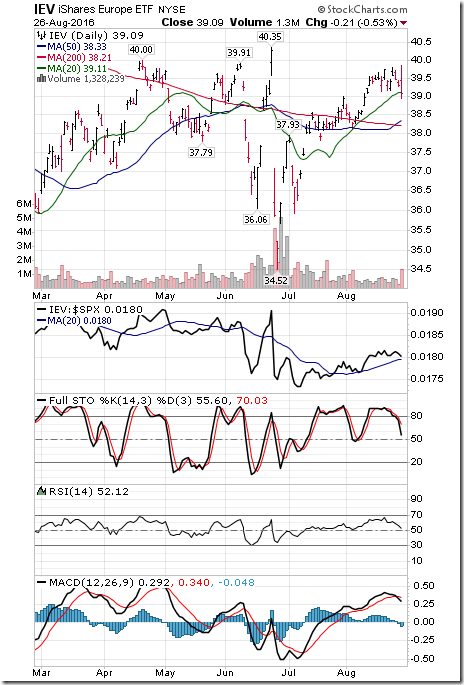
Europe iShares dropped $0.32 (0.81%) last week. Intermediate trend remains down. Strength relative to the S&P 500 Index remains positive. Units fell below their 20 day moving average on Friday. Short term momentum indicators are trending down. Technical score dropped last week to -2 from 2.
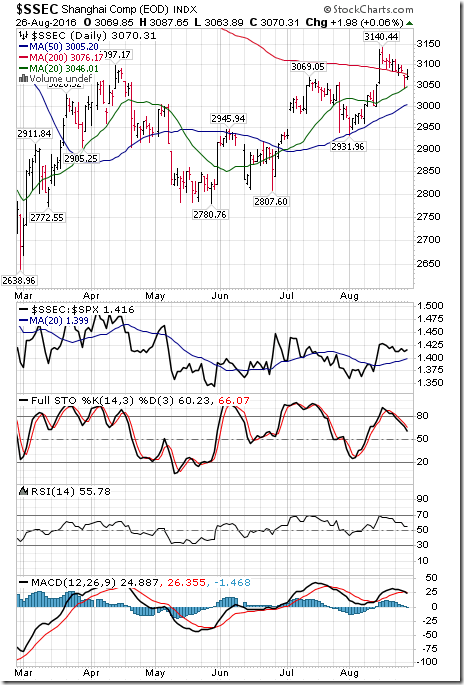
The Shanghai Composite Index dropped 37.79 points (1.22%) last week. Intermediate trend remains up. Strength relative to the S&P 500 Index remains positive. The Index remained above its 20 day moving average. Short term momentum indicators are trending down. Technical score dropped last week to 4 from 6.
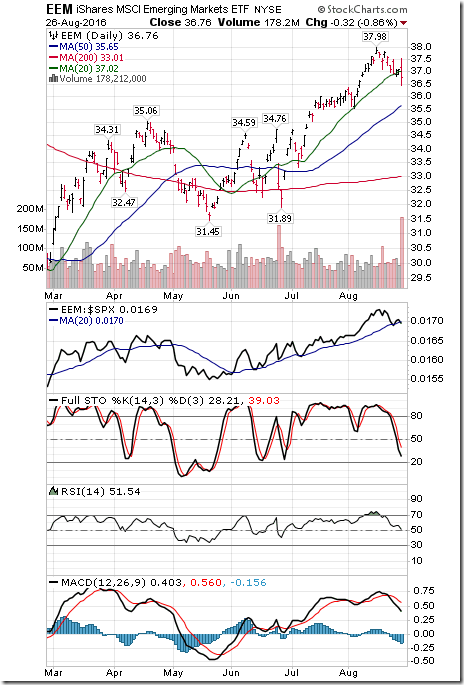
Emerging Markets iShares dropped $0.84 (2.23%) last week. Strength relative to the S&P 500 Index remained positive. Units dropped below their 20 day average on Friday. Short term momentum indicators are trending down. Technical score slipped last week to 2 from 4.
Currencies
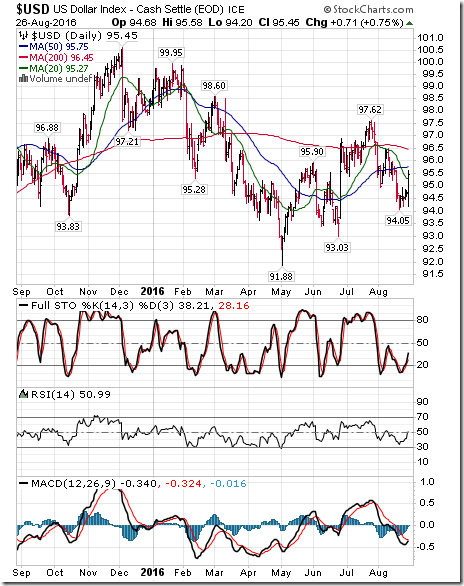
The U.S. Dollar Index added 0.97 (1.03%) last week with most of the gain occurring on Friday following Yellen’s speech. The Index moved above its 20 day moving average on Friday. Short term momentum indicators are trending up.
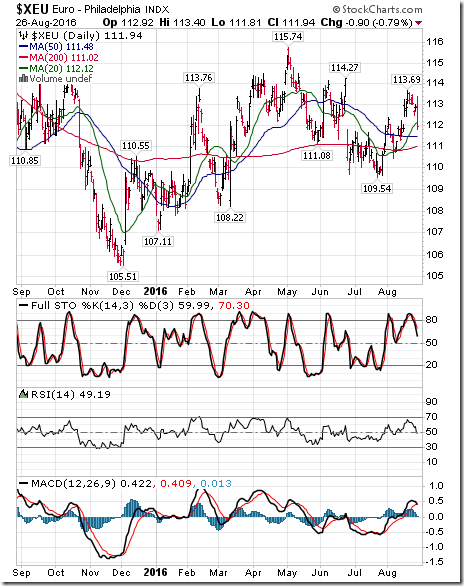
The Euro dropped 1.31 (1.16%) last week. Intermediate trend remains neutral. The Euro dropped below its 20 day moving average on Friday. Short term momentum indicators are trending down.
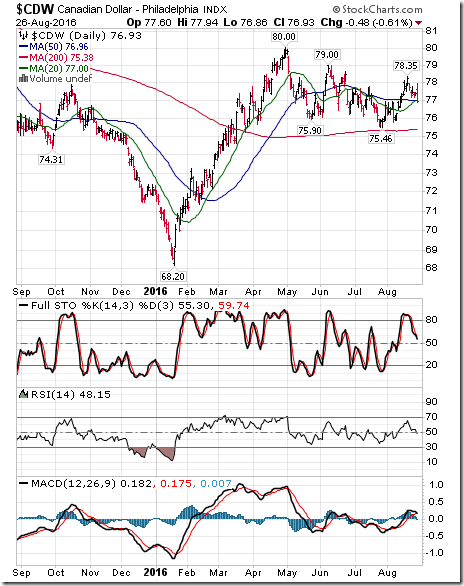
The Canadian Dollar dropped US 0.80 cents (1.03%) last week. Intermediate trend remains down. The Canuck Buck dropped below its 20 day moving average on Friday. Short term momentum indicators are trending down.
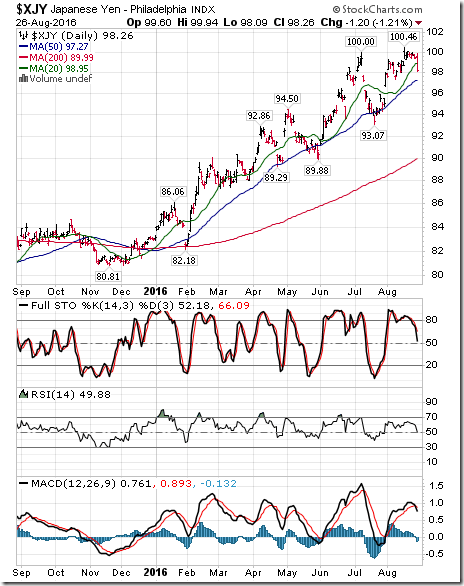
The Japanese Yen dropped 1.55 (1.55%) last week. Most of the drop occurred on Friday. The Yen dropped below its 20 day moving average on Friday. Short term momentum indicators are trending down.
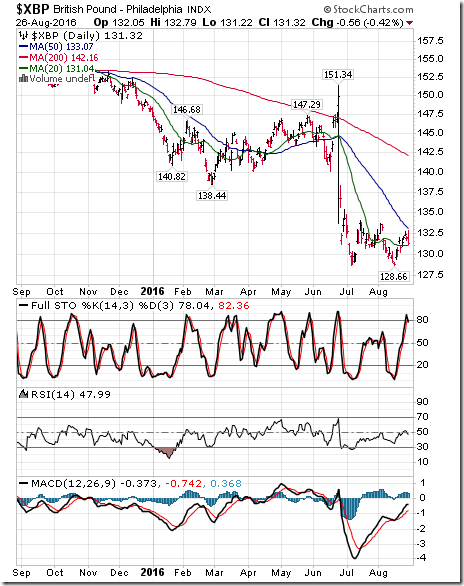
The British Pound added 0.55 (0.42%) last week. Intermediate trend remains down. The Pound moved above its 20 day moving average. Short term momentum indicators are trending up.
Commodities
Daily Seasonal/Technical Commodities Trends for August 26th 2016
Green: Increase from previous day
Red: Decrease from previous day
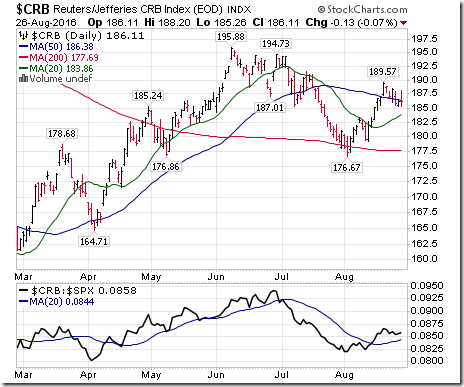
The CRB Index dropped 2.67 points (1.41%) last week. Intermediate trend remains down. Strength relative to the S&P 500 Index remains positive. The Index remains above its 20 day moving average. Short term momentum indicators are trending down. Technical score slipped last week to 0 from 2.
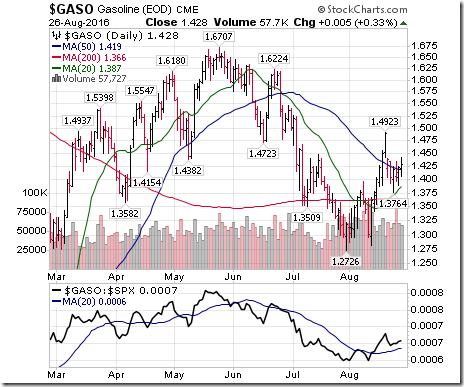
Gasoline dropped 8.2 cents per gallon (5.43%) last week. Intermediate trend remains down. Strength relative to the S&P 500 Index remained positive. Gas remained above its 20 day moving average. Short term momentum indicators are trending down. Score: 0
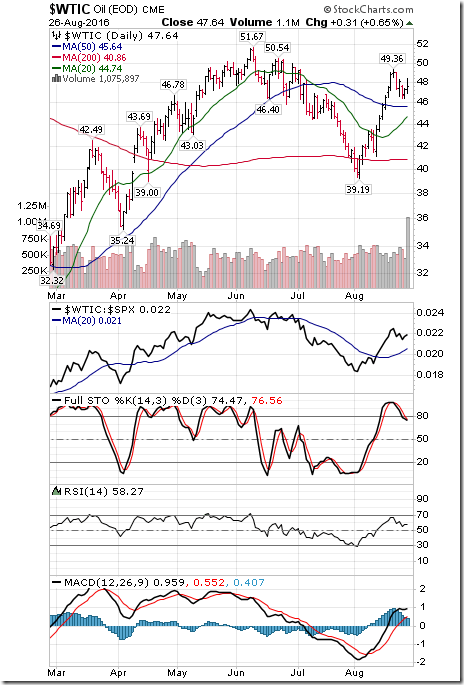
Crude Oil dropped $1.47 per barrel (3.00%) lasts week. Intermediate trend remains up. Strength relative to the S&P 500 Index remains positive. Crude remains above its 20 day moving average. Short term momentum indicators have turned down. Technical score dropped last week to 4 from 6.
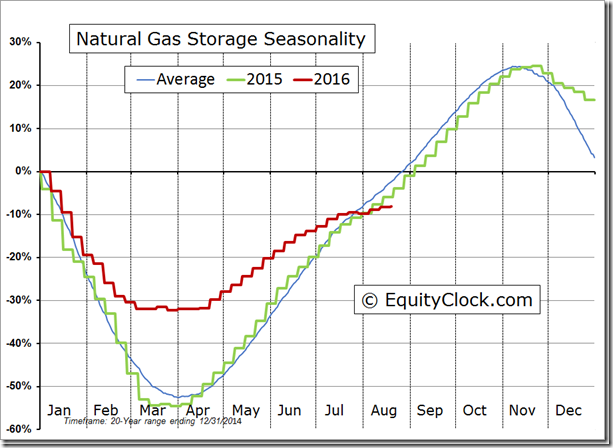
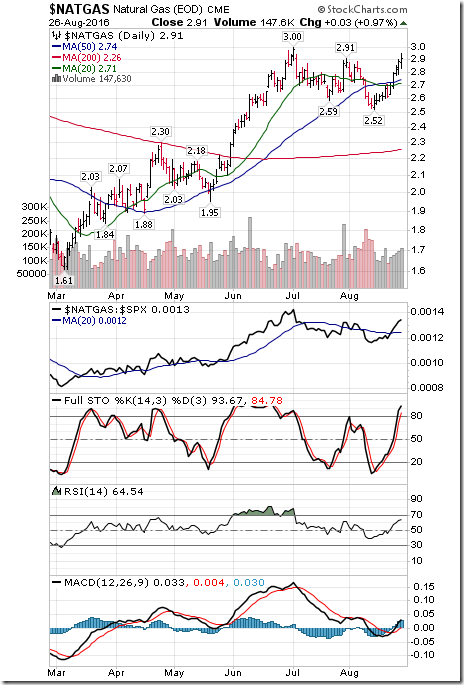
Natural Gas gained $0.33 per MBtu (12.79%) last week. Intermediate trend changed to neutral from down on a move above $2.91 on Friday. Strength relative to the S&P 500 Index changed positive from negative. “Natty” moved above its 20 day moving average. Short term momentum indicators are trending up. Technical score improved last week to 4 from -4.
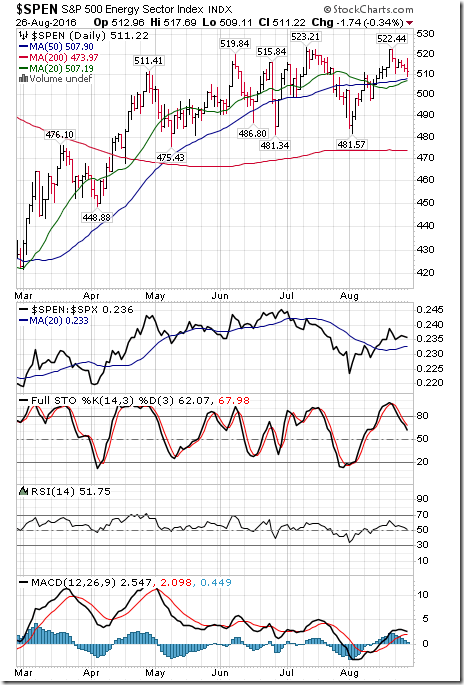
The S&P Energy Index dropped 6.93 points (1.34%) last week. Intermediate trend remains neutral. Strength relative to the S&P 500 Index remains positive. The Index remains above its 20 day moving average. Short term momentum indicators are trending down. Technical score slipped last week to 2 from 4.
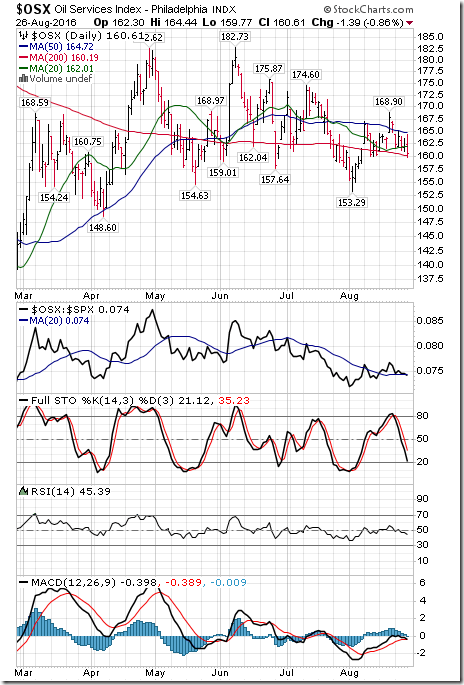
The Philadelphia Oil Services Index dropped 5.69 points (3.42%) last week. Intermediate trend remains down. Strength relative to the S&P 500 Index changed to neutral from positive. The Index dropped below its 20 day moving average. Short term momentum indicators are trending down. Technical score dropped last week to -4 from 2.
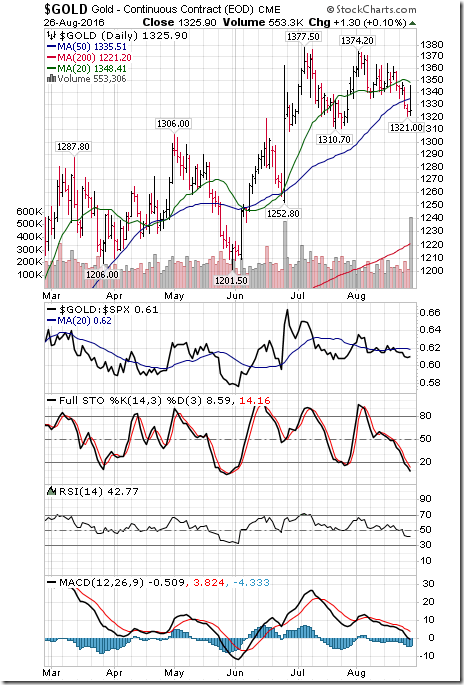
Gold dropped $20.30 per ounce (1.51%) last week. Intermediate trend remains up. Strength relative to the S&P 500 Index remained neutral. Gold remained below its 20 day moving average. Short term momentum indicators are trending down. Technical score remained last week at 0
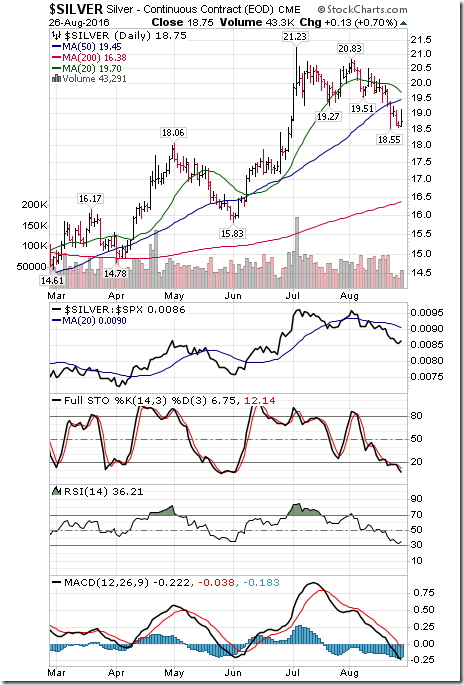
Silver dropped $0.57 per ounce (2.95%) last week. Intermediate trend remains down. Strength relative to the S&P 500 Index remains negative. Silver remains below its 20 day moving average. Short term momentum indicators are trending down. Technical score remained at -6. Strength relative to gold remains positive.
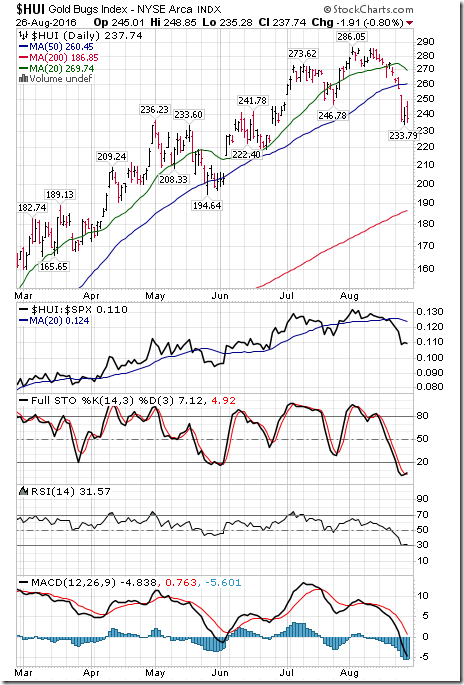
The AMEX Gold Bug Index plunged 25.79 points (9.79%) last week. Intermediate trend changed to neutral from up on a move below $246.78. Strength relative to the S&P 500 Index turned negative. The Index remained below its 20 day moving average. Short term momentum indicators are trending down. Technical score dropped last week to -4 from 0. Strength relative to Gold is negative.
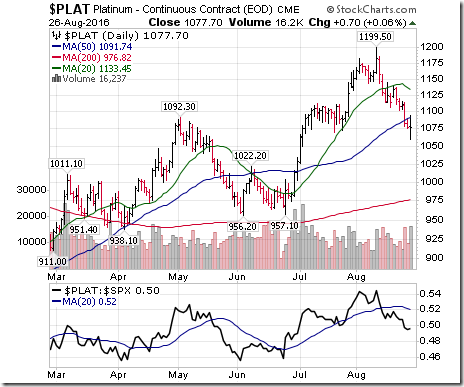
Platinum dropped $40.00 per ounce (3.64%) last week. Trend remains up. Relative strength remains negative. PLAT remains below its 20 day MA. Momentum down. Score: -2
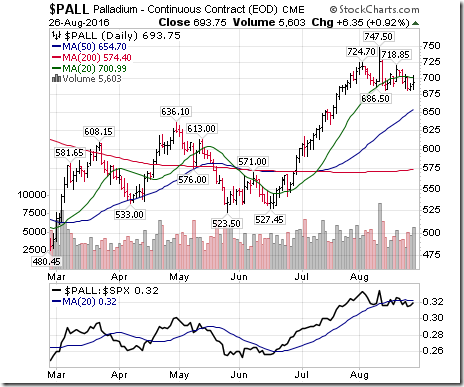
Palladium dropped $15.60 per ounce. Intermediate trend remains up. Relative strength remains neutral. PALL moved below its 20 day moving average. Short term momentum indicators are trending down. Technical score slipped last week to 0 from 2.
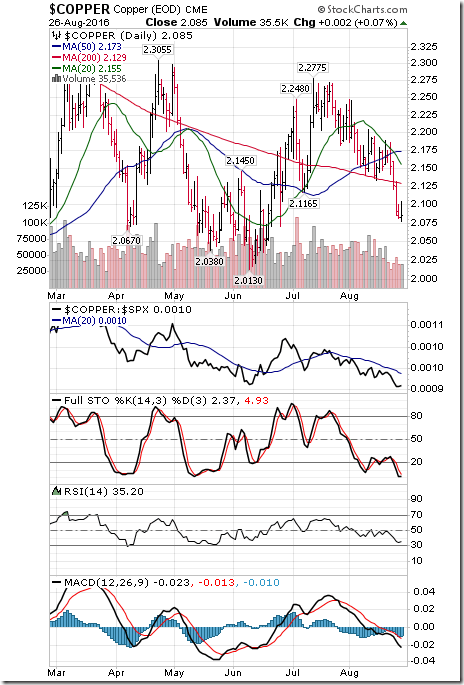
Copper dropped 8.2 cents per lb. (3.78%) last week. Intermediate trend remains neutral. Strength relative to the S&P 500 Index remains negative. Copper remains below its 20 day moving average. Short term momentum indicators have turned down. Technical score dipped last week to -4 from -2
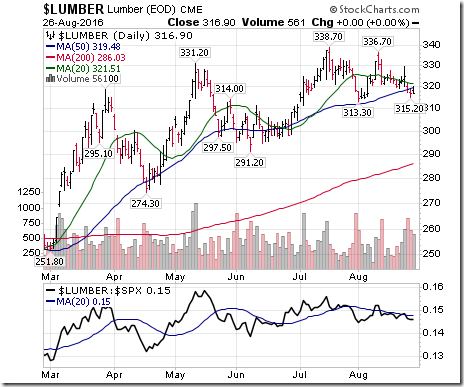
Lumber dropped 5.40 (1.68%) last week. Trend remains up. Relative strength remains neutral. Lumber remains below its 20 day MA. Momentum remains down. Score remained at 0
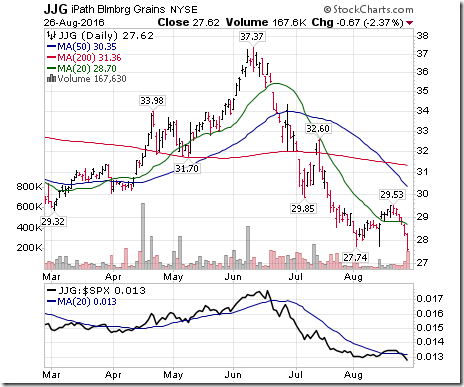
The Grain ETN dropped $1.78 (7.05%) last week. Downtrend confirmed on Friday on a break below $27.74. Relative strength turned negative. Units dropped below their 20 day moving average. Shor term momentum indicators are trending down. Score dropped to -6 from 0.
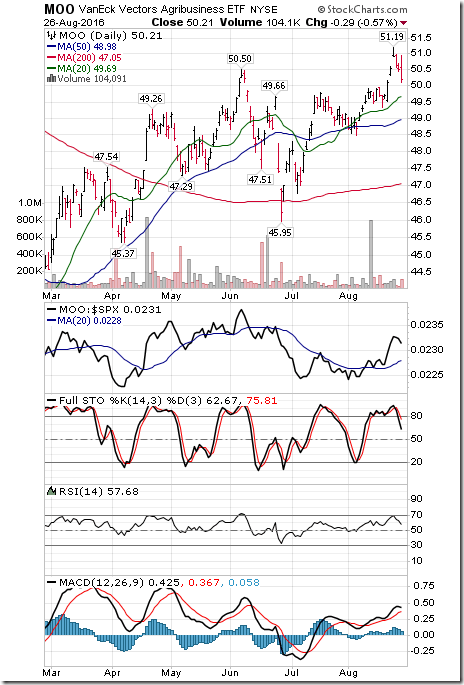
The Agriculture ETF added $0.11 (0.22%) last week. Intermediate trend changed to up from neutral on a move above $50.50. Strength relative to the S&P 500 Index remains positive. Units remained above their 20 day moving average. Short term momentum indicators have just turned down. Technical score last week remained at 4.
Interest Rates
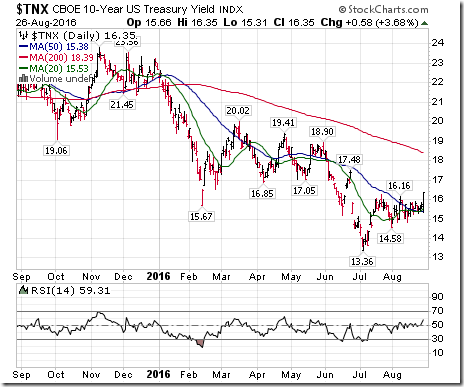
Yield on 10 year Treasuries gained 5.7 basis points (3.61%) last week with all of the gain occurring on Friday following Yellen’s speech. Intermediate trend changed on Friday to up from down on a move above 1.62%. Short term momentum indicators are trending up. Yield remained above its 20 day moving average.
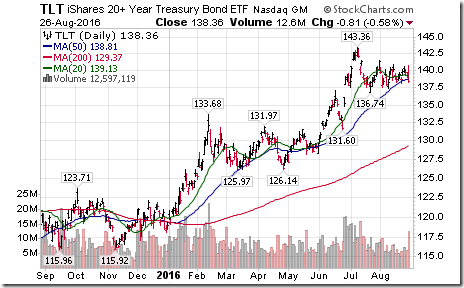
Conversely, price of the long term Treasury ETF fell $0.35 (0.25%) last week. Intermediate trend remains up. Price dropped below its 20 day moving average on Friday.
Volatility
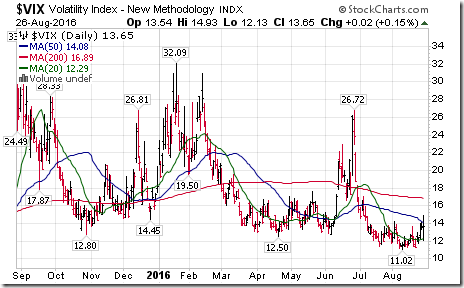
The VIX Index jumped 2.31 (20.37%) last week. Intermediate trend remains down. The Index moved above its 20 day moving average.
Sectors
Daily Seasonal/Technical Sector Trends for August 26th 2016
Green: Increase from previous day
Red: Decrease from previous day
StockTwits Released on Friday @EquityClock
Price of natural gas moving above a flag pattern as inventory gains remain below average.
Technical action by S&P 500 stocks to 10:00: Bullish. Breakouts: $BK, $JPM, $L, $LNC, $DOW, $ECL. Breakdown: $TGNA.
Editor’s comment: After 10:00 AM EDT, PNC and SPGI broke resistance and COST, ANTM and EXPE broke support.
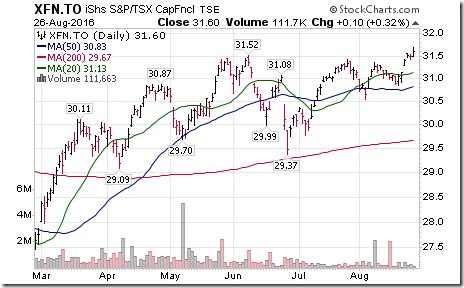
Nice breakout by TSX Financials ETF $XFN.CA above $31.52 to an all-time high extending uptrend.
Special Free Services available through www.equityclock.com
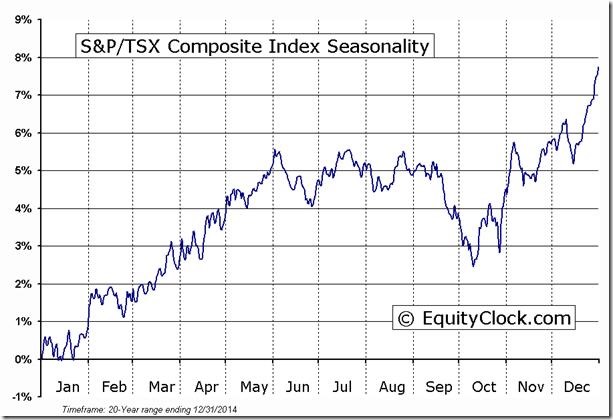
Equityclock.com is offering free access to a data base showing seasonal studies on individual stocks and sectors. The data base holds seasonality studies on over 1000 big and moderate cap securities and indices. To login, simply go to http://www.equityclock.com/charts/ Following is an example:
MARK LEIBOVIT – WALL STREET RAW RADIO August 29:
Here is the link:
My guests are White House correspondent, William Koenig and Sinclair Noe from Eatthebankers.com
Disclaimer: Seasonality and technical ratings offered in this report by www.timingthemarket.ca and www.equityclock.com are for information only. They should not be considered as advice to purchase or to sell mentioned securities. Data offered in this report is believed to be accurate, but is not guaranteed
Copyright © DV Tech Talk, Timingthemarket.ca


![clip_image002[6] clip_image002[6]](https://advisoranalyst.com/wp-content/uploads/2019/08/627d21c2b3006595a51c578d56b86fe6.png)
![clip_image002[8] clip_image002[8]](https://advisoranalyst.com/wp-content/uploads/2019/08/b9a93da5ae21989afd8791a1c563e08e.png)
![clip_image002[10] clip_image002[10]](https://advisoranalyst.com/wp-content/uploads/2019/08/69dba5c247fb7b8572297668ca6b4900.png)
