
Is Tactical Broken?
by Corey Hoffstein, Newfound Research
Summary
- Many tactically risk-managed strategies use trend following to manage the risk of severe drawdowns, but in sideways markets, like those experienced in 2011 and 2015, trend following ends up lagging the market by buying high and selling low.
- As with insurance policies or static allocations to bonds, this underperformance is an implicit cost of managing risk.
- Underperformance in periods where a strategy is not expected to do well is not a sign the approach is broken, but rather than the manager has stayed true to their process. On the other hand, underperformance during periods well-suited to a manager’s process is much more alarming.
- By both choosing an appropriate benchmark for tactical strategies and evaluating over a full market cycle, we can more accurately gauge true costs and benefits and see how they can be used within a portfolio to manage risk in a market where both equities and bonds have low growth prospects.
A consistent theme we have heard in the last year is that investors are beginning to question whether tactical approaches still work.
Having been strong advocates for tactical risk management since our firm was founded in 2008, we wanted to take the opportunity to take a step back and re-evaluate the expectations and role of tactical management in today’s market.
What do we mean by tactical?
Before we explore our views on whether tactical is broken or not, we think it is important to be very specific as to what we mean by tactical in this commentary.
When people say tactical, they often mean one of two things.
The first is alpha-seeking tactical, where a manager seeks to allocate to asset classes that they expect to outperform on either a total return or risk-adjusted return basis. For example, a manager may have a moderate risk strategic benchmark, but overweight emerging market vs. domestic equities based on a higher return outlook.
The second type of tactical, which became far more prevalent post-2008, is risk-managed tactical. In this approach, a manager has the flexibility to de-risk relative to their strategic benchmark in an effort to avoid significant capital losses.
These two approaches are not necessarily mutually exclusive. For example, there are many tactical multi-asset portfolios that seek to tilt towards greater return opportunities in favorable markets while still preserving the opportunity to move to a defensive allocation in unfavorable ones.
How different managers choose to make tactical calls is also highly varied. Some look at macro-economic conditions. Some look at fundamental data. Others take purely quantitative approaches like relative momentum or trend-following. Some combine multiple approaches.
Newfound’s flavor of tactical applies a trend-following approach in an effort to manage risk. So our discussion of tactical – both its applications and its limitations – in this commentary will be limited to that very specific approach.
Feeling nauseous from whipsaw
When we speak to investors that are questioning the ongoing efficacy of tactical, it is often because of the recent whipsaw they have experienced. Whipsaws occur when a manager buys high and sells low.
In a prolonged sideways market, a trend-following methodology can struggle if it is head-faked by market action. This can lead the system to sell after sell-offs and buy after rallies. So while the market ultimately goes nowhere, the trend-following system ends up experiencing the downs and missing out on the ups, ultimately eroding portfolio value.
Recency bias is the tendency to think that what is happening now will continue to persist in the future. At worst, we extrapolate recent experience into an infinite future. So when a trend-following approach goes through a period of underperformance due to whipsaw, it is a natural reaction to begin to question whether it is the new normal. Investors ask themselves, “Has the market fundamentally changed in such a way that this process no longer works?” Each whipsaw only reaffirms the creeping suspicions.
To counteract this recency bias, we believe it is important to reset our understanding of trend-following at a fundamental level.
Why do we believe in trend-following?
We believe that any investment approach should be backed by data, but also strongly grounded in theory. For us to believe that the success is not merely an artifact of data mining, we should demand a sufficient answer to the question, “Why did this strategy work?” Only with that answer can we begin to explore the question, “Do we think this strategy will continue to work in the future?”
Trend-following, a subset of momentum investing, has a long and storied history. At its core, we believe that several behavioral biases create sustainable trends that can be exploited by trend-followers.
The most prevalent biases are:
- Herding: Investors tend to mimic the actions of larger groups.
- Anchoring Bias: Investors tend to rely too heavily on the first piece of information they receive.
- Confirmation Bias: Investors tend to ignore information that contradicts their prior beliefs.
- Disposition Effect: Investors tend to hold on to losers too long and sell winners too early.
These biases combine to create under- and over-reaction effects that result in trends. We illustrate this concept below.
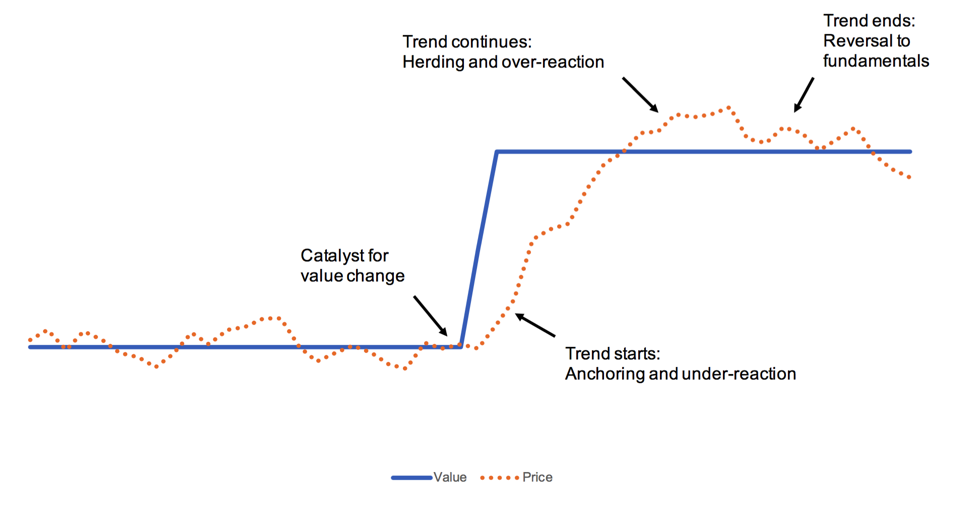
In this illustration, the underlying value of a security jumps from one level to another. Investors, however, underreact to the new information because they discount it relative to their old information (anchoring bias and confirmation bias). The price slowly moves towards the underlying value. At a point, however, investors begin herding into the trade, causing price to overshoot the true underlying value. Eventually the price reverts to the true fundamentals.
A trend-follower seeks to systematically exploit this behavior by investing as soon as a trend emerges and selling as soon as a trend ends.
For trend-following to be permanently broken, one of several things would have to be true:
- Markets have become efficient enough to eliminate trends.
- Humans no longer exhibit the behavioral biases that lead to trends.
- The markets are manipulated to prevent trends.
We find it highly unlikely that humans have stopped exhibiting these behavioral biases since they are deeply rooted in human psychology and present in many walks of life, not just investing. Therefore, for trend-following to be “broken,” we’d have to believe that trends have been eliminated by increased efficiency or market manipulation.
2015: Trends Everywhere
The easiest way to dismiss the notion that trends no longer exist is to shine a big, bright light on just how many large trends there were in 2015.
While U.S. large-caps were largely stuck in a sideways regime, we continued to see evidence from around the globe that a systematic trend-following approach can significantly increase risk-adjusted returns.
Below we show the maximum drawdown in 2015 for a number of global asset classes along with the maximum drawdown for the same asset overlaid with a simple trend-following system (a cross-over of price versus a 10-month moving average).
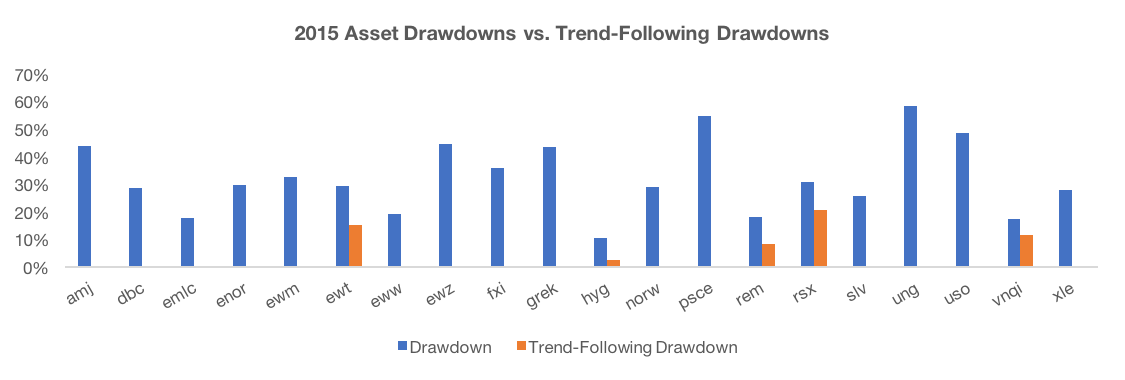
Source: Yahoo! Finance. Analysis by Newfound Research. Results are hypothetical and do not reflect the results of any strategy offered by Newfound Research.
The blue bars represent the maximum intra-year 2015 drawdown for the asset class. The orange bars represent the maximum drawdown once the overlay is applied. In all cases, trend-following reduced the drawdown. In many cases, the drawdown was completely eliminated since our toy trend-following model would have had you completely removed from these asset classes for the entire year.
So is trend-following broken? We think 2015 provided ample evidence that global trend-following is alive and well.
When is something broken?
Perhaps trend-following is alive and well globally, but it no longer works for core U.S. equities.
Many point to the underperformance of tactical U.S. equity strategies over the last year as evidence.
We’re reluctant to ever call a process broken due to short-term underperformance. In fact, we believe that all strategies with any long-term efficacy must occasionally underperform in the short term.
Rather, we become concerned when a process fails to work in an environment that should be well-suited to its success. Or conversely, if the process does work when it shouldn’t, as counterintuitive as that sounds. Most people don’t investigate that bit, but we think it is important to distinguish good luck from skill. (Note: a strategy’s performance straying from expectations in a given market regime may also be a sign of style drift, which could be equally concerning).
With the benefit of hindsight, since March 2009, there really has not been a single time that significantly de-risking a U.S. equity portfolio was the right decision. So this has not been a case of “not working when it should,” but rather a case of “not working when it shouldn’t.”
That doesn’t make underperformance from whipsaw any less frustrating, but we do not believe the whipsaw itself is evidence of a broken process. In fact, we should expect whipsaw in a sideways market from a trend-following process; it is the implicit cost we pay for the ability to protect in severely down markets.
The cost of risk management
Risk management, no matter its form, always has a cost.
In every day life, we’re used to paying explicit costs for protection in the form of insurance premiums. We pay health insurance, car insurance, renters/homeowners insurance. We pay to install and maintain security systems and sprinkler systems. We install lightning rods. In some parts of the country we build tornado shelters. Our taxes pay for firemen and policemen.
Many risk management techniques also have implicit costs in the form of allocations of valuable time and resources. For example, we practice fire drills, which interrupt our workday. We spend time building business continuity plans that may never get used. We allocate significant resources away from growth endeavors and towards compliance departments to manage regulatory risk.
Portfolio management is no different: there are both explicit and implicit costs to managing risk.
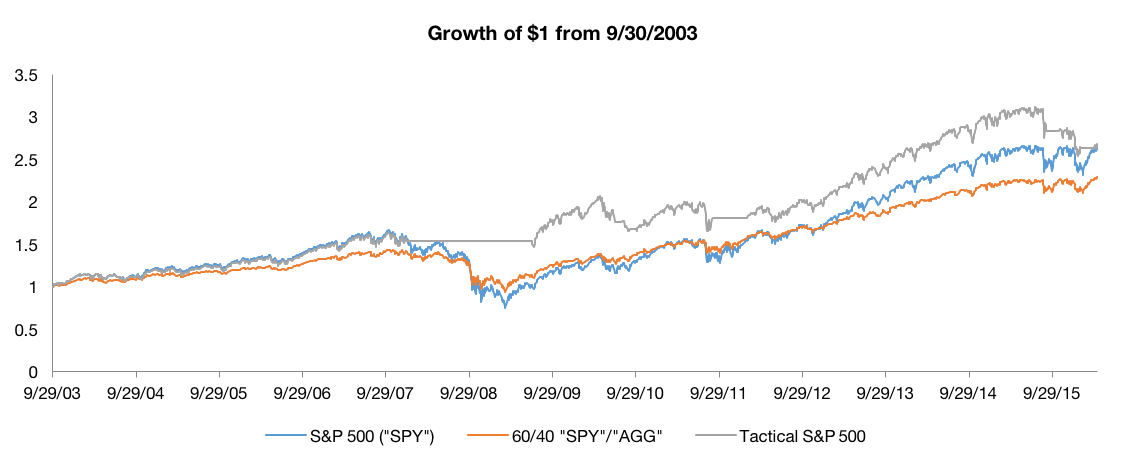
Consider that since 2/28/2009, a 40% allocation to the Barclays Aggregate has created an annualized performance drag of 500 basis points (“bps”) a year versus the S&P 500. Most investors accept this drag in a strategic 60/40 portfolio performance as the implicit cost of protection against uncertainty.
Similarly, since 2/28/2009, a simple 10-month simple moving average system overlaid on top of the S&P 500 since March 2009 would have created a 900bps annualized return drag.
In defense of the trend-following system, 223bps of this annualized underperformance simply came from the fact that the tactical strategy sat in cash until July 2009 while the market rebounded – but there still remains a 677bps of annualized underperformance due to whipsaw.

Source: Yahoo! Finance. Analysis by Newfound Research. Results are hypothetical and do not reflect the results of any strategy offered by Newfound Research. The S&P 500 is represented by the SPDR S&P 500 ETF “SPY”. The 60/40 “SPY”/”AGG” portfolio is a 60% / 40% split portfolio, rebalanced monthly, between the SPRD S&P 500 ETF “SPY” and the iShares Barclays Aggregate Bond ETF “AGG”. The Tactical S&P 500 portfolio is a strategy that invests in the SPDR S&P 500 ETF “SPY” when it is above its 10-month moving average and in cash when below, rebalanced monthly. All indices assume the re-investment of dividends, are net of underlying ETF expenses but are gross of any advisor fees or trading costs.
Despite our prior protests, surely the significant underperformance versus a simple buy-and-hold, strategically allocated system is final nail in the coffin for tactical…
Don’t evaluate risk management with the benefit of hindsight
We’re not going to bother discussing why we believe there are a few simple portfolio changes that would significantly reduce the annualized drag in the simple tactical portfolio used as an example. Instead, we think it is important to highlight that we are evaluating these portfolios over a period of time that we would expect them to lag behind the market.
If we knew the market was going to go up, after all, we wouldn’t bother introducing risk management techniques at all. To paraphrase ourselves,
Risk management is important precisely because we do not know what the future holds. As a result, evaluating its worth with the benefit of hindsight, where there is no uncertainty, can be at best misleading and at worst downright dangerous.
The evaluation of any risk management technique over a time period when risk did not need to be managed is going to be negative. It is like evaluating your flood insurance policy over a period with no floods.
What happens if we rewind the clock and look at a full market cycle, including both periods when risk needs to be managed and when it does not?
Source: Yahoo! Finance. Analysis by Newfound Research. Results are hypothetical and do not reflect the results of any strategy offered by Newfound Research. The S&P 500 is represented by the SPDR S&P 500 ETF “SPY”. The 60/40 “SPY”/”AGG” portfolio is a 60% / 40% split portfolio, rebalanced monthly, between the SPRD S&P 500 ETF “SPY” and the iShares Barclays Aggregate Bond ETF “AGG”. The Tactical S&P 500 portfolio is a strategy that invests in the SPDR S&P 500 ETF “SPY” when it is above its 10-month moving average and in cash when below, rebalanced monthly. All indices assume the re-investment of dividends, are net of underlying ETF expenses but are gross of any advisor fees or trading costs.
From a full cycle perspective, the drag of both a strategic fixed income allocation and a tactical approach is significantly reduced due to the protection they offered in late 2007, 2008, and early 2009 periods.
Managing the risk of how we manage risk
At Newfound, we believe that risk can be transformed but never destroyed.
The protection that fixed income provides against an unforeseen loss – the removal of downside risk – results in a significant reduction in upside participation. We can think of this as the addition of underperformance risk.
The same applies to a tactical approach. In theory, it helps reduce the risk of being directionally misallocated in significantly trending markets (whether up or down), but it also increases the risk of whipsaw in sideways markets.
Neither approach eliminates risk: they both simply transfer it from one form to another. A strategic 60/40 will still take significant losses in years like 2008 and lag behind in years like 2013. A tactical approach will suffer from whipsaw in years like 2011 and 2015.
We should expect both approaches to underperform at some point. The fact that we expect them to underperform in different environments should give us hope that we can take advantage of diversification. Creating a 50/50 portfolio of a strategic allocation and a tactical allocation may create impressive results over a full market cycle.
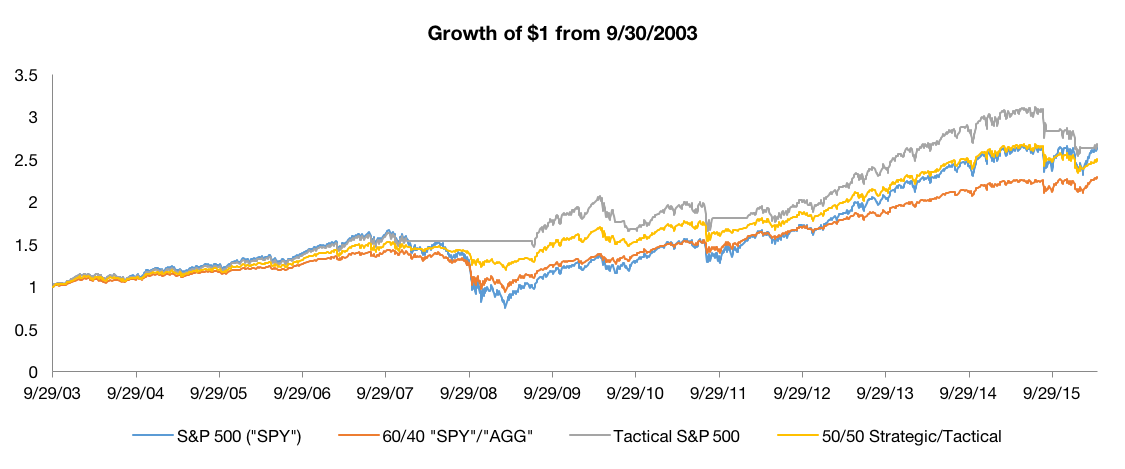
Source: Yahoo! Finance. Analysis by Newfound Research. Results are hypothetical and do not reflect the results of any strategy offered by Newfound Research. The S&P 500 is represented by the SPDR S&P 500 ETF “SPY”. The 60/40 “SPY”/”AGG” portfolio is a 60% / 40% split portfolio, rebalanced monthly, between the SPRD S&P 500 ETF “SPY” and the iShares Barclays Aggregate Bond ETF “AGG”. The Tactical S&P 500 portfolio is a strategy that invests in the SPDR S&P 500 ETF “SPY” when it is above its 10-month moving average and in cash when below, rebalanced monthly. The 50/50 Strategic/Tactical portfolio invests 50% of its assets in the 60/40 “SPY”/”AGG” portfolio and 50% in the Tactical S&P 500 portfolio, rebalanced monthly. All indices assume the re-investment of dividends, are net of underlying ETF expenses but are gross of any advisor fees or trading costs.
We can see that our mixed portfolio (in yellow above) only slightly underperforms the S&P 500 (by 52bp annualized), but has significantly lower volatility (7.75% vs 14.48%) and max drawdown (-21.82% vs -55.19%). The performance in the years when the strategic 60/40 lagged (2008 and 2013) and when tactical lagged (2011 and 2015) is also improved relative to using only one of the two approaches.
Tactical Equity: what’s in a name?
In our opinion, tactical isn’t broken, but it does have a branding problem.
All too often we see investors comparing tactical to an all equity benchmark, but changing their expectations based on the current environment.
A tactical strategy trailing by 500bps is tolerable if the market is up 30%, but suddenly insufferable if the market is up only 2% for the year.
Investors expect an absolute return downside and a relative return upside. They want a free call option that is re-struck from any new high water mark made by their portfolio.
On the topic of hedge funds, one anonymous analyst said, "If you call them “alternative asset managers,” you won’t be disappointed when you find they don’t hedge."
The same advice could probably be applied to “tactical equity.”
If we re-named the approach to “equity hedge” or “tail-hedged equities,” would our expectations be more appropriately set? Would we be more tolerant of underperformance in up markets and the high cost of hedging when risk does not materialize? Would we more willingly stomach short-term performance deviations?
With a name like “dynamic equity long/flat,” would we have more realistic expectations for performance?
Re-evaluating tactical benchmarks
In an ideal world, benchmarks tell us everything we need to know about an active strategy. They tell us what sort of total return target we are trying to beat, what sort of risk profile we may have, and how to use an active strategy in our asset allocation profile.
We believe an ideal benchmark has the following characteristics:
- It is easily and cheaply replicable.
- It provides a return target to evaluate against (either total or risk-adjusted).
- It provides a sense of the overall risk profile of a strategy.
- It informs the investor where a strategy fits in a portfolio.
- It rewards an active manager’s good decisions and punishes his bad ones.
Benchmarking a traditional stock picker is easy. If the beginning universe for the stock picker is the S&P 500, then the S&P 500 is a perfectly suitable benchmark. It hits all of our criteria.
Now consider using the S&P 500 as a benchmark for a tactical equity strategy. The key problem is that it does not reward the manager for the active decision to be invested in good years.
When it comes to tactical strategies, we believe custom benchmarks are necessary.
The good news is that we think the right custom benchmark should be fairly intuitive to construct, especially for more transparent, rules-based tactical managers.
Consider a slightly more complicated tactical strategy. It first makes the decision to be “in or out” of equities. When it is invested, it can invest in any mix of large-cap or small-cap U.S. equities. When it is defensive, it can buy any mix of short- or long-dated U.S. Treasuries. How would we benchmark this?
We would recommend a portfolio that is 25% large-cap, 25% small-cap, 25% short-term U.S. Treasuries and 25% long-term U.S. Treasuries. How did we get there?
Since the first decision made by the portfolio is “in or out,” we split the portfolio in half. One half will represent the benchmark for “in” and the other half will represent the benchmark for “out.” This both rewards good and punishes bad in-or-out decisions.
Then, within each of these sleeves we again split the portfolio in half for the two decisions that could be made. So for the “in” sleeve, our choice is either large-cap or small-cap equities. Since we have full range to invest in either, a fifty-fifty split is appropriate. The same logic goes for the defensive sleeve.
Let’s consider a slightly more complicated multi-asset strategy, which is comprised of five equally weighted sleeves: U.S. equities, international equities, commodities, mid-term U.S. Treasuries, and commodities. Each of these sleeves can be either invested or in short-term U.S. Treasuries. What’s our benchmark?
We’d recommend a portfolio that is 10% in each of the five sleeves and 50% short-term U.S. Treasuries. Our logic for getting here is similar to above. Each sleeve has an “in-or-out” decision, and so should be benchmarked as 50% in and 50% out. This leaves us with a 10% allocation to each of the five asset classes and a 50% position in short-term U.S. Treasuries.
We believe these sorts of custom benchmarks provide much better transparency into multi-year performance expectations. Furthermore, they help inform an investor as to how they should fit the strategy in a portfolio: namely, in the same proportion of the assets in the benchmark.
So if a tactical equity portfolio is benchmarked against a 50% S&P 500 / 50% short-term U.S. Treasury index, then we believe the best way to allocate to it is by taking equally from both core equity and fixed income positions.
Tactical: Core or Alternative?
One of the questions we consistently receive is, “should tactical equity be a core holding or a part of my alternative sleeve?”
Theoretically, if the asset classes in the tactical benchmark are core holdings, then there is no reason that tactical cannot be a core holding.
The real answer, however, has more to do with the investor than it does with the strategy itself.
If the investor can tolerate high degrees of tracking error, then there is no reason that tactical cannot be a core holding. We find that these tend to be investors who think about portfolio construction holistically and are less sensitive to short-term underperformance.
On the other end of the spectrum are investors who are highly sensitive to tracking error, scrutinizing their portfolio holding-by-holding on a quarterly basis. For these investors, tactical may make more sense as an alternative play, as these holdings are often given more leeway in their performance.
After all, to get the benefits of tactical, an investor will have to treat it as an allocation, not a trade. Periods of whipsaw must be stomached so that we can get the benefit of trend-following in high trend environments. We must always try to be holders instead of folders.
An easy litmus test is to ask is: “would I allocate to managed futures as a core holding?” If the answer is “no,” then tactical equity probably shouldn’t be a core holding either.
Is tactical relevant today?
So we’ve laid the foundation for why we believe tactical works and will continue to work.
We’ve demonstrated that, over a full market cycle, tactical may help us diversify the way in which portfolio risk is managed.
We’ve addressed what we believe are realistic expectations for tactical and defined how we believe these portfolios should be benchmarked.
What we have not discussed is whether tactical is at all relevant in today’s market.
When equity markets are trading at historically low valuations (like the early 1980s or in 2009), the better trade is often to pursue risk, not pay extra to manage it. Tactical equity, and even fixed income, may create an unnecessary drag.
From where we sit in 2016, U.S. equity markets look expensive. The Shiller CAPE sits at 26.35 and the Buffett indicator (equity market capitalization / GDP) is just shy of 120% – a level only exceeded in the late 1990s. These are often indicators of low forward returns.
That is not to say that a significant market correction or crash is imminent. There may be asignificant argument as to why the current Shiller CAPE is overstated or why the long-term historical average of 16.7 is the wrong yardstick to measure against. Nevertheless, we believe that the prudent trade is to consider how to manage risk, not chase return.
Historically, when core fixed income offered a significant yield, tilting our allocation towards bonds may have made sense. Today, however, 10-year U.S. Treasuries offer a paltry sub-2% yield. Increasing the allocation to core fixed income simply trades one risk (an equity market correction) for another risk (failing to meet growth goals due to zero real yields in fixed income).
We believe that in today’s environment – where stocks are expensive and bonds may be an expensive risk management approach – tactical equity offers a balance, with the opportunity to continue to participate in market growth and seek to shelter against losses if a correction emerges.
Copyright © Newfound Research