
SIA Weekly: Brazil Turnaround?
For this week's SIA Equity Leaders Weekly, we are going to look at two Brazil based ETFs: one within the SIA International Equity Emerging Markets Report, the iShares MSCI Brazil Capped ETF, and a highly ranked currency ETF, the Wisdom Tree Brazilian Real Strategy Fund ETF. Whether you have been specifically looking at either the Emerging Markets or Currency sector ETF reports, or just scanning a broad universe of names, one country name that for the past few months that has risen to the top of many of these reports has been Brazil based ETFs.
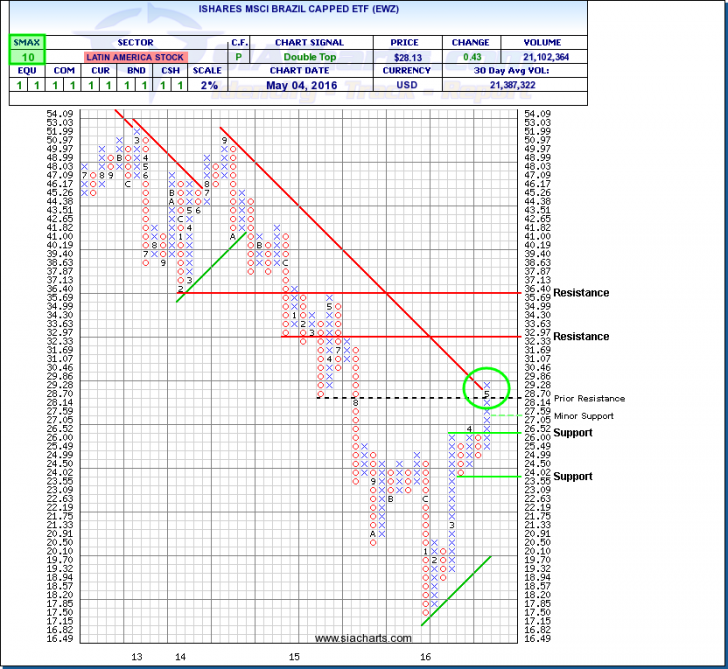
iShares MSCI Brazil Capped ETF (EWZ)
Brazil, Latin America’s largest economy, is one of the most volatile emerging markets. For the iShares MSCI Brazil Capped ETF (EWZ) that seeks to track the investment results of Brazilian equities, that much is confirmed by a three-year standard deviation of nearly 29%. Bloomberg recently reported that the move higher starting in early March by Brazilian stocks has been aided by the country’s corruption crackdown. Brazilian shares jumped as many traders believed the country is moving past a political gridlock that could lead to changes in the government and potentially kick-start the stagnate economy. With this new found bullishness after years of political drama and a sinking economy, benchmark indexes are now trading at the highest multiples in a decade.
Looking at the chart of EWZ you can see that the turnaround began in February and first saw a major leg up in March, and then again recently with the shares breaking through its long-term down-trend line last week. The down-trend line began over a year and a half ago and saw the shares deteriorate from the $50 level down to $17.50. This recent reversal had EWZ break through many resistance levels and finally that trend line. From here if the strength continues, further resistance levels will be found at around $30, $33, and then $36. In many cases, the break of long-term trend lines could follow with possible re-tests of prior resistance levels which are now new support levels. Levels at $26, and $23.55 are such support levels where pull backs could be seen while still in this new up-trend.
Click on Image to Enlarge
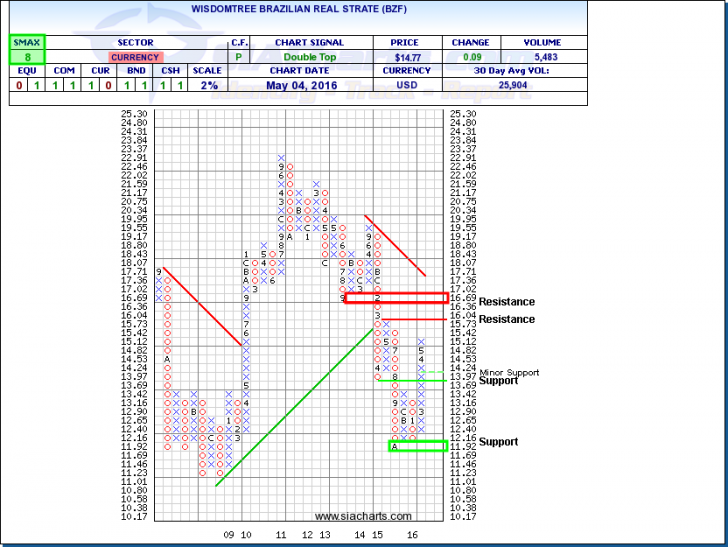
WisdomTree Brazilian Real Strategy Fund (BZF)
Since the WisdomTree Brazilian Real Fund (BZF) tracks the money market rates in Brazil real (BRL) currency relative to the U.S. dollar, and with the recent weakness of the U.S. dollar, it is no surprise that currencies such as the Brazilian Real would be showing strength against it. Starting in February the real has been rallying sharply, supported by weakness in the US dollar, stabilizing commodity prices, and similar to what was mentioned above, the expectations of a political reform in Brazil which is drawing investments into the economy.
However, the last couple of days have seen some effects of the central bank intervening in the attempt to weaken the currency in order to protect the nation’s exports. But looking at the chart, these recent moves by Brazil’s central bank have had no major impacts so far to BZF. Bouncing off January lows just under $12, the shares have moved strongly through resistance at $14 and are closing in on additional resistance at around $16. Past that level, further potential barricades appear at around the $17 area. For a reversal due to the central bank measures or other influences, support will be found at the prior resistance level at $13.69, and then much lower to January lows at the $11.92 and $11.69 level.
Click on Image to Enlarge
For a more in-depth analysis on the relative strength of the equity markets, real estate, bonds, commodities, currencies, etc. or for more information on SIACharts.com, you can contact our customer support at 1-877-668-1332 or siateam@siacharts.com.
SIACharts.com specifically represents that it does not give investment advice or advocate the purchase or sale of any security or investment. None of the information contained in this website or document constitutes an offer to sell or the solicitation of an offer to buy any security or other investment or an offer to provide investment services of any kind. Neither SIACharts.com (FundCharts Inc.) nor its third party content providers shall be liable for any errors, inaccuracies or delays in content, or for any actions taken in reliance thereon.
Copyright © SIACharts.com