
Stock markets around the world have run into a number of headwinds this year that have led to a series of rolling takedowns that have played out at different times across indices and sectors. In the US, much of the uncertainty has been related to a hawkish Fed and rising interest rates. Outside of the US, uncertainty related to how trade tensions between the US and China, the UK and the EU and other flashpoints could affect economies have impacted indices and commodities.
So far this week, equity trading has been mixed although there has been an increasing sense that the worst of the selloff may be over in many markets and we are bouncing along the bottom. Yesterdays big gains in US markets suggest that after weeks of looking for reasons to run for the exits, investors are starting to find reasons to step back in could potentially set the stage for a Santa Claus Rally into December.
In this issue of Equity Leaders Weekly, we look at the potential impact of yesterday’s speech by Fed Chair Jerome Powell may have on interest rates and the outlook for stocks beyond the initial relief rally. We also revisit the natural gas price as winter home heating season approaches.
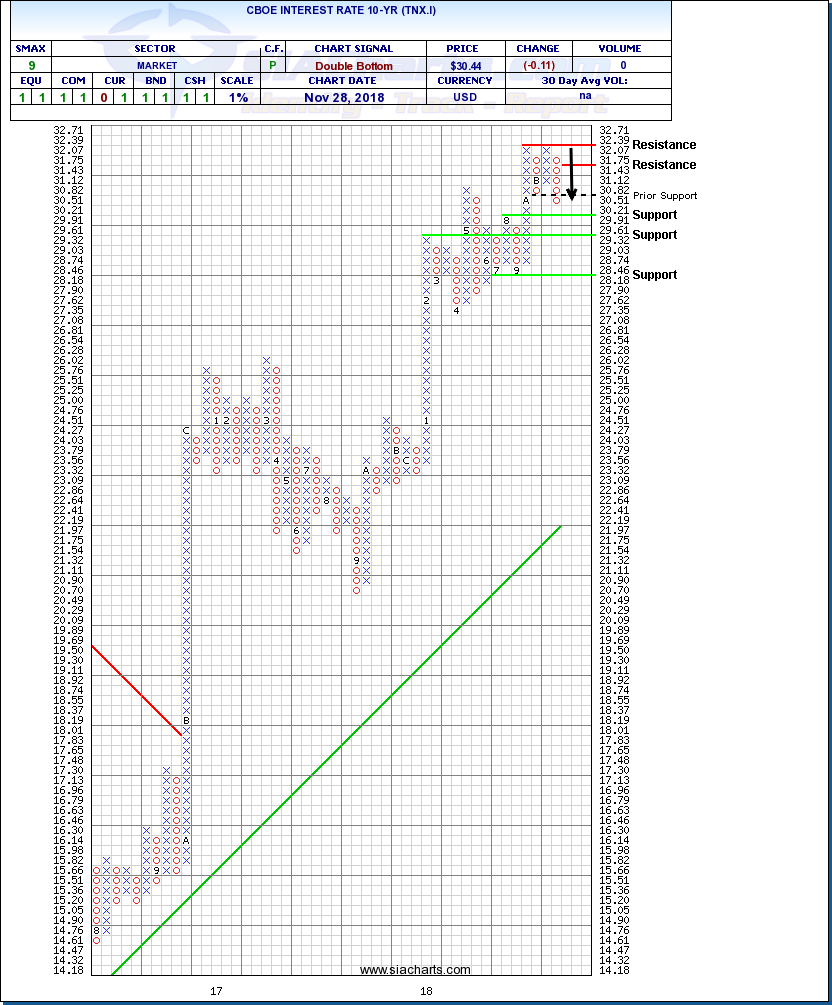
CBOE Interest Rate 10-Year (TNX.I)
Rising US interest rates have had a significant impact on stock markets throughout the year. A hawkish Fed has been steadily taking away the easy money rocket fuel that had backed stock market gains through much of this decade, and put a tailwind behind the US Dollar, impacting the earnings prospects of US-based multinational companies. The February US selloff followed the 30-year treasury yield breaking out over 3.00%, while the October US selloff started just after the 10-year treasury yield broke out over 3.00%.
On Wednesday, Fed Chair Jerome Powell indicated that he sees US interest rates as being close to the neutral rate, in contrast to a couple of months ago when he saw rates as still being far below the neutral rate. He also reiterated that the Fed is not on a pre-determined path indicating flexibility. These comments sparked a 600-point gain for the Dow as investors read these comments as dialling back the Fed’s hawkish stance and meaning potentially fewer rate hikes in 2019 than previously expected.
Even before Powell’s comments, TNX.I had already been trending downward, backsliding after a failed attempt to break through resistance near 3.23%. A break of TNX.I below 3.00% could spark a resurgence of interest in US equities.
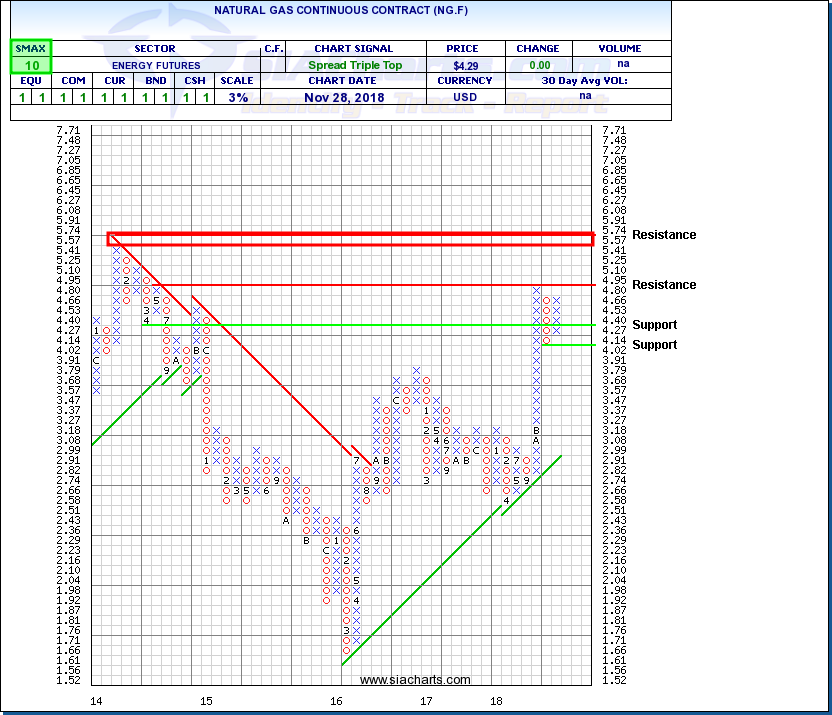
Natural Gas Continuous Contract (NG.F)
The one bright spot in what has been a dismal autumn for energy commodities has been natural gas. Since we last wrote about NG.F in Equity Leaders Weekly on October 4th, the contract is up 43.0% in contrast with a 22.6% plunge in Gasoline and a 16.3% drop in WTI crude oil over the same time frame.
The early arrival of winter temperatures in many regions boosting heating demand combined with lower than average inventories coming out of last winter and underinvestment in recent years leaving producers unable to catch up over the summer has raised questions about shortages and ignited a big rally in Natural Gas.
The breakout over $3.22/mmbtu In October completed a bullish Spread Quadruple Top that was like a dam bursting, as the price really took off from there, driving up into the $4.00 to $5.00 range where it has paused to consolidate its quick gains. Support at a higher level suggests that this advance may not be over yet with most of winter still ahead of us. Initial resistance has emerged near $5.00/mmbtu with next potential upside tests at the previous high near $5.57 then $5.74 based on a horizontal count up out of the base. Initial support appears near $4.02 a previous column low. A perfect bullish SMAX score of 10 indicates that NG.F is exhibiting strength across the asset classes.
SIACharts.com specifically represents that it does not give investment advice or advocate the purchase or sale of any security or investment. None of the information contained in this website or document constitutes an offer to sell or the solicitation of an offer to buy any security or other investment or an offer to provide investment services of any kind. Neither SIACharts.com (FundCharts Inc.) nor its third party content providers shall be liable for any errors, inaccuracies or delays in content, or for any actions taken in reliance thereon.