
As frustrating as it may be to see the market go nowhere after a massive runup, the inescapable math of discounted cash flows (DCF) indicates this is exactly what the market should be doing.
Key takeaways
• The S&P 500® has made little headway since year-end, despite soaring earnings growth.
• Blame the rising cost of capital in the denominator (r) of the DCF model, which is fully offsetting earnings growth (E) in its numerator.
• How and when will this impasse be resolved? My guess: not until 2019, when we’ll have more clarity on earnings growth and where the Federal Reserve will end its rate-hike cycle.
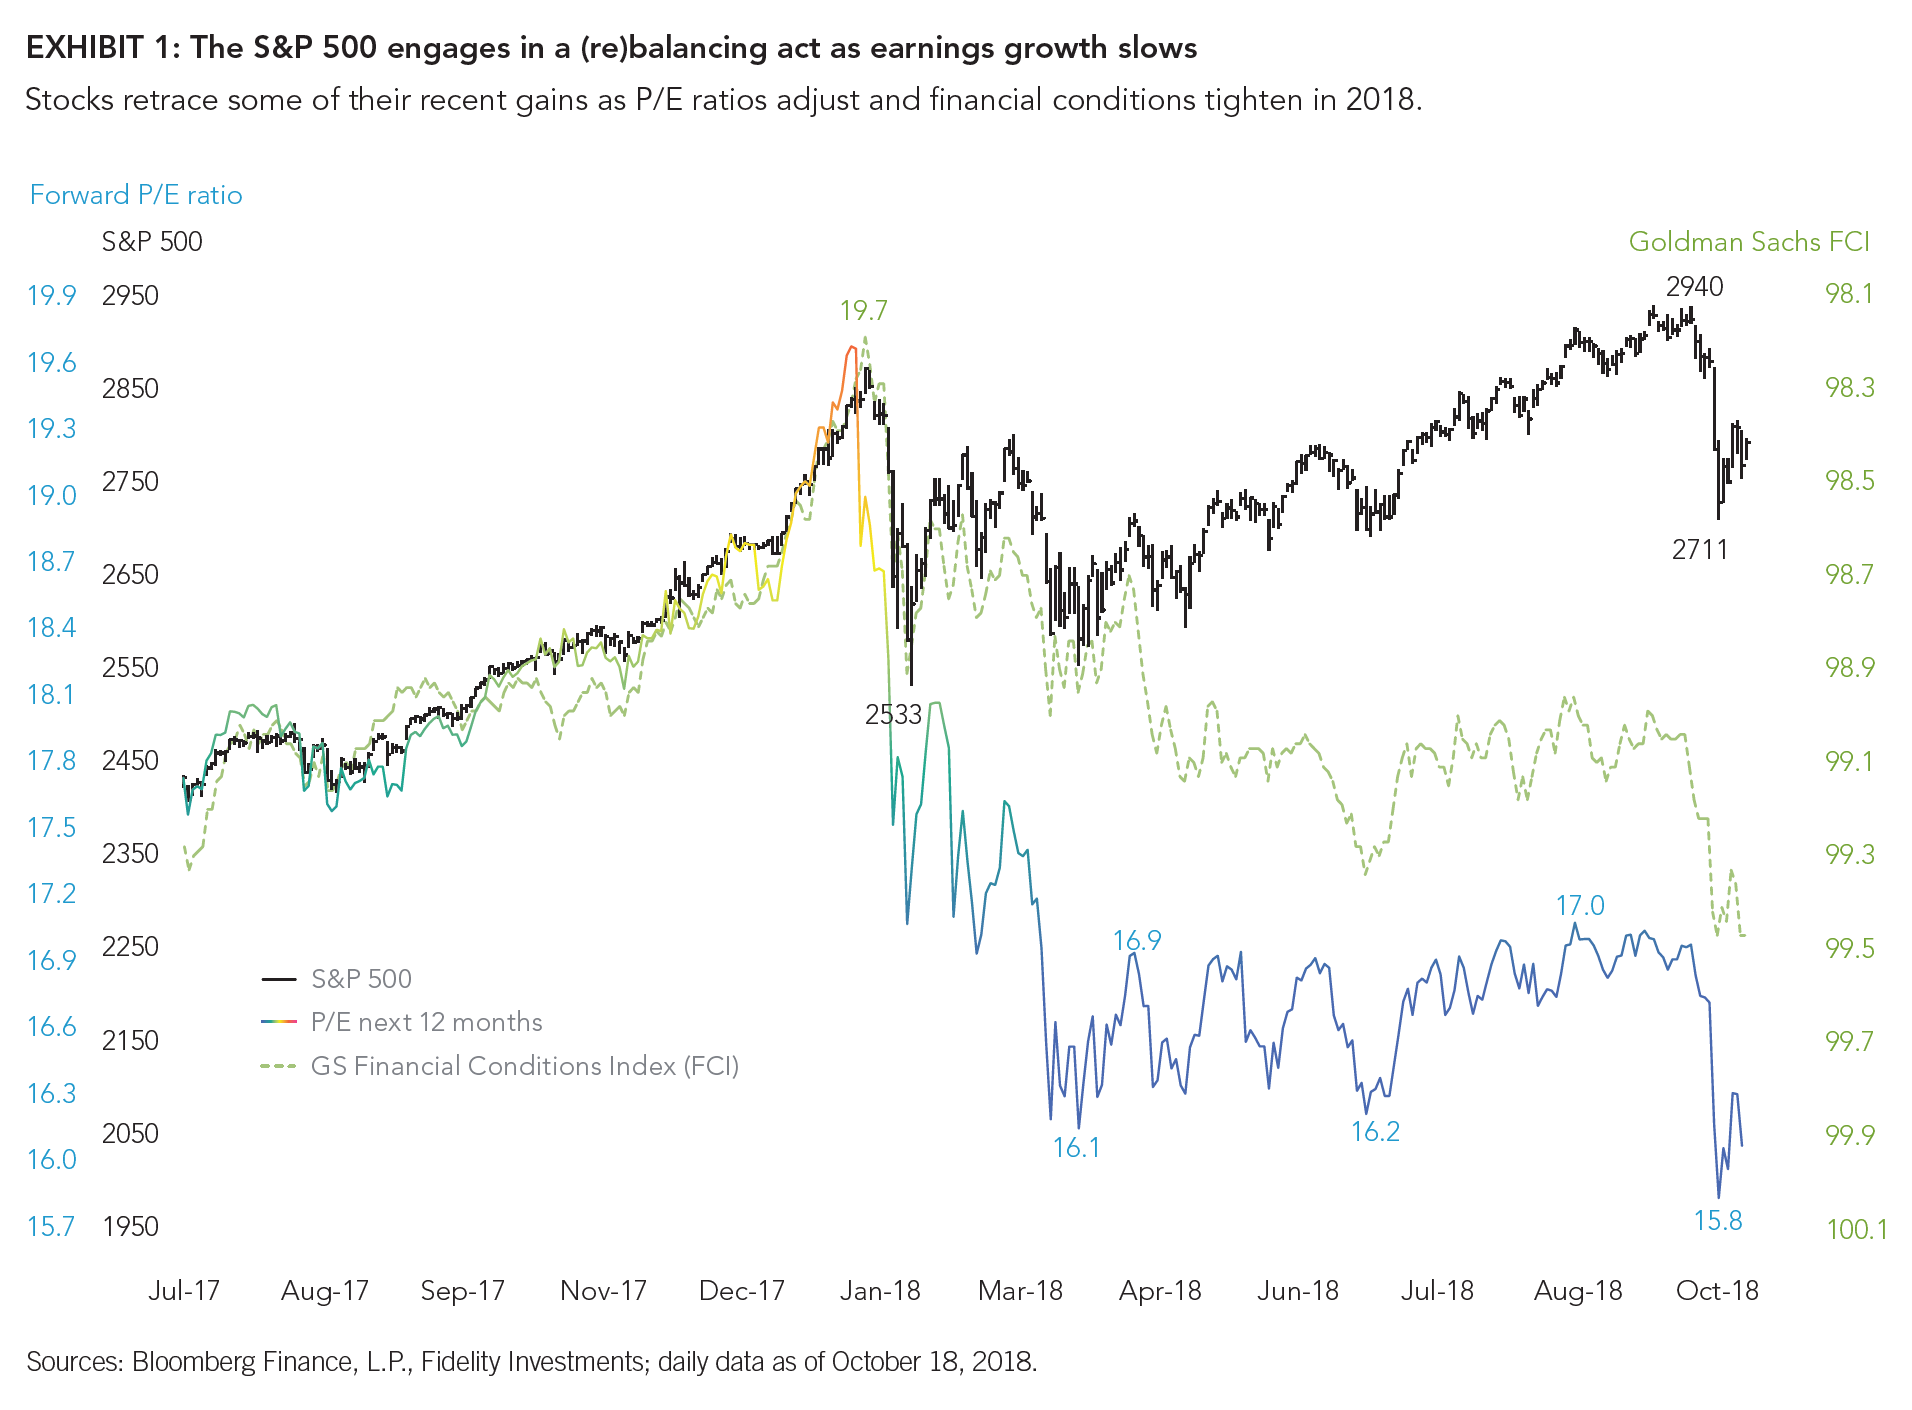
• Meanwhile, valuations continue to improve, with the forward price/earnings ratio briefly dipping below 16 during the recent sell-off.
Recently, the market found itself squarely in the crosshairs of a standoff between the numerator and the denominator of the discounted cash-flow equation. In its basic form, DCF modeling projects a series of future cash flows (based on earnings and earnings growth), then discounts those future flows back to today (based on the time value of money) using some cost of capital.
The sum of all future discounted flows is a company’s or market’s present value. In its general form, I’ve been looking at discounted cash flows using the U.S. equity market’s 5-year expected growth in EPS (earnings per share) divided by the sum of the 10-year Treasury yield and the equity risk premium.
The numerator (E, or earnings growth in this case) has, of course, been booming all year, running at a year-over- year growth rate of 24%. But earnings growth seems to be peaking now, based on consensus estimates for Q3 and Q4, albeit off of a very high level. The latest estimate for Q3 2018 is 19%, and with earnings season just underway, we’ve already seen a few high-profile earnings misses. Rising labor costs, economic slowing in China, higher oil prices, and a strengthening U.S. dollar are being blamed.
At the same time, the cost of capital in the denominator (r, a proxy for the overall liquidity environment) has been rising as liquidity conditions have been growing more restrictive. In fact, rates have risen sharply in recent weeks as the U.S. Federal Reserve has been guiding the bond market to a steeper and perhaps longer path of rate hikes, aiming to reach the 3.0%–3.5% zone for the federal funds target rate by late 2020.
The 10-year Treasury yield has risen 45 basis points since late August, and the forward yield curve is pricing in an additional one-and-a-half rate hikes to a total of three-and-a-half increases. The simple market math of the DCF model is that when earnings are growing and liquidity conditions are accommodative, valuations go up.
Similarly, when the market’s price/earnings (P/E) ratio expands along with earnings, then the P in this equation must go up more than its E (by definition). That’s your roaring bull market “Goldilocks” mid-cycle scenario. The worst-case scenario is that the E goes down and liquidity conditions are tight, driving the P/E down. A falling P/E plus a falling E means that P goes down a lot.
In the middle is where we find ourselves at this point in 2018: Earnings growth is booming—but peaking—and liquidity conditions are tightening as the Fed normalizes U.S. monetary policy by raising interest rates and shrinking its balance sheet.
Against a backdrop where other major central banks (namely, the European Central Bank and the Bank of Japan) are still in easing mode, this creates a policy divergence that is driving the dollar higher and financial conditions tighter. Add some trade tensions and, voilà, you have a recipe for lower valuations (Exhibit 1).
But because the E in P/E is still growing, the P/E pressure hasn’t been enough to cause a bear market, merely a stalling-out of the bull market. This is exactly what we have seen happen this year.
So what was the recent equity turmoil all about? In my view, it was in recognition that the market is not out of the woods yet. We have future Fed rate hikes to contend with and a slowing of earnings growth. That means that the P/E headwinds could continue to blow, which in turn means that the P will have to rise less than the E.
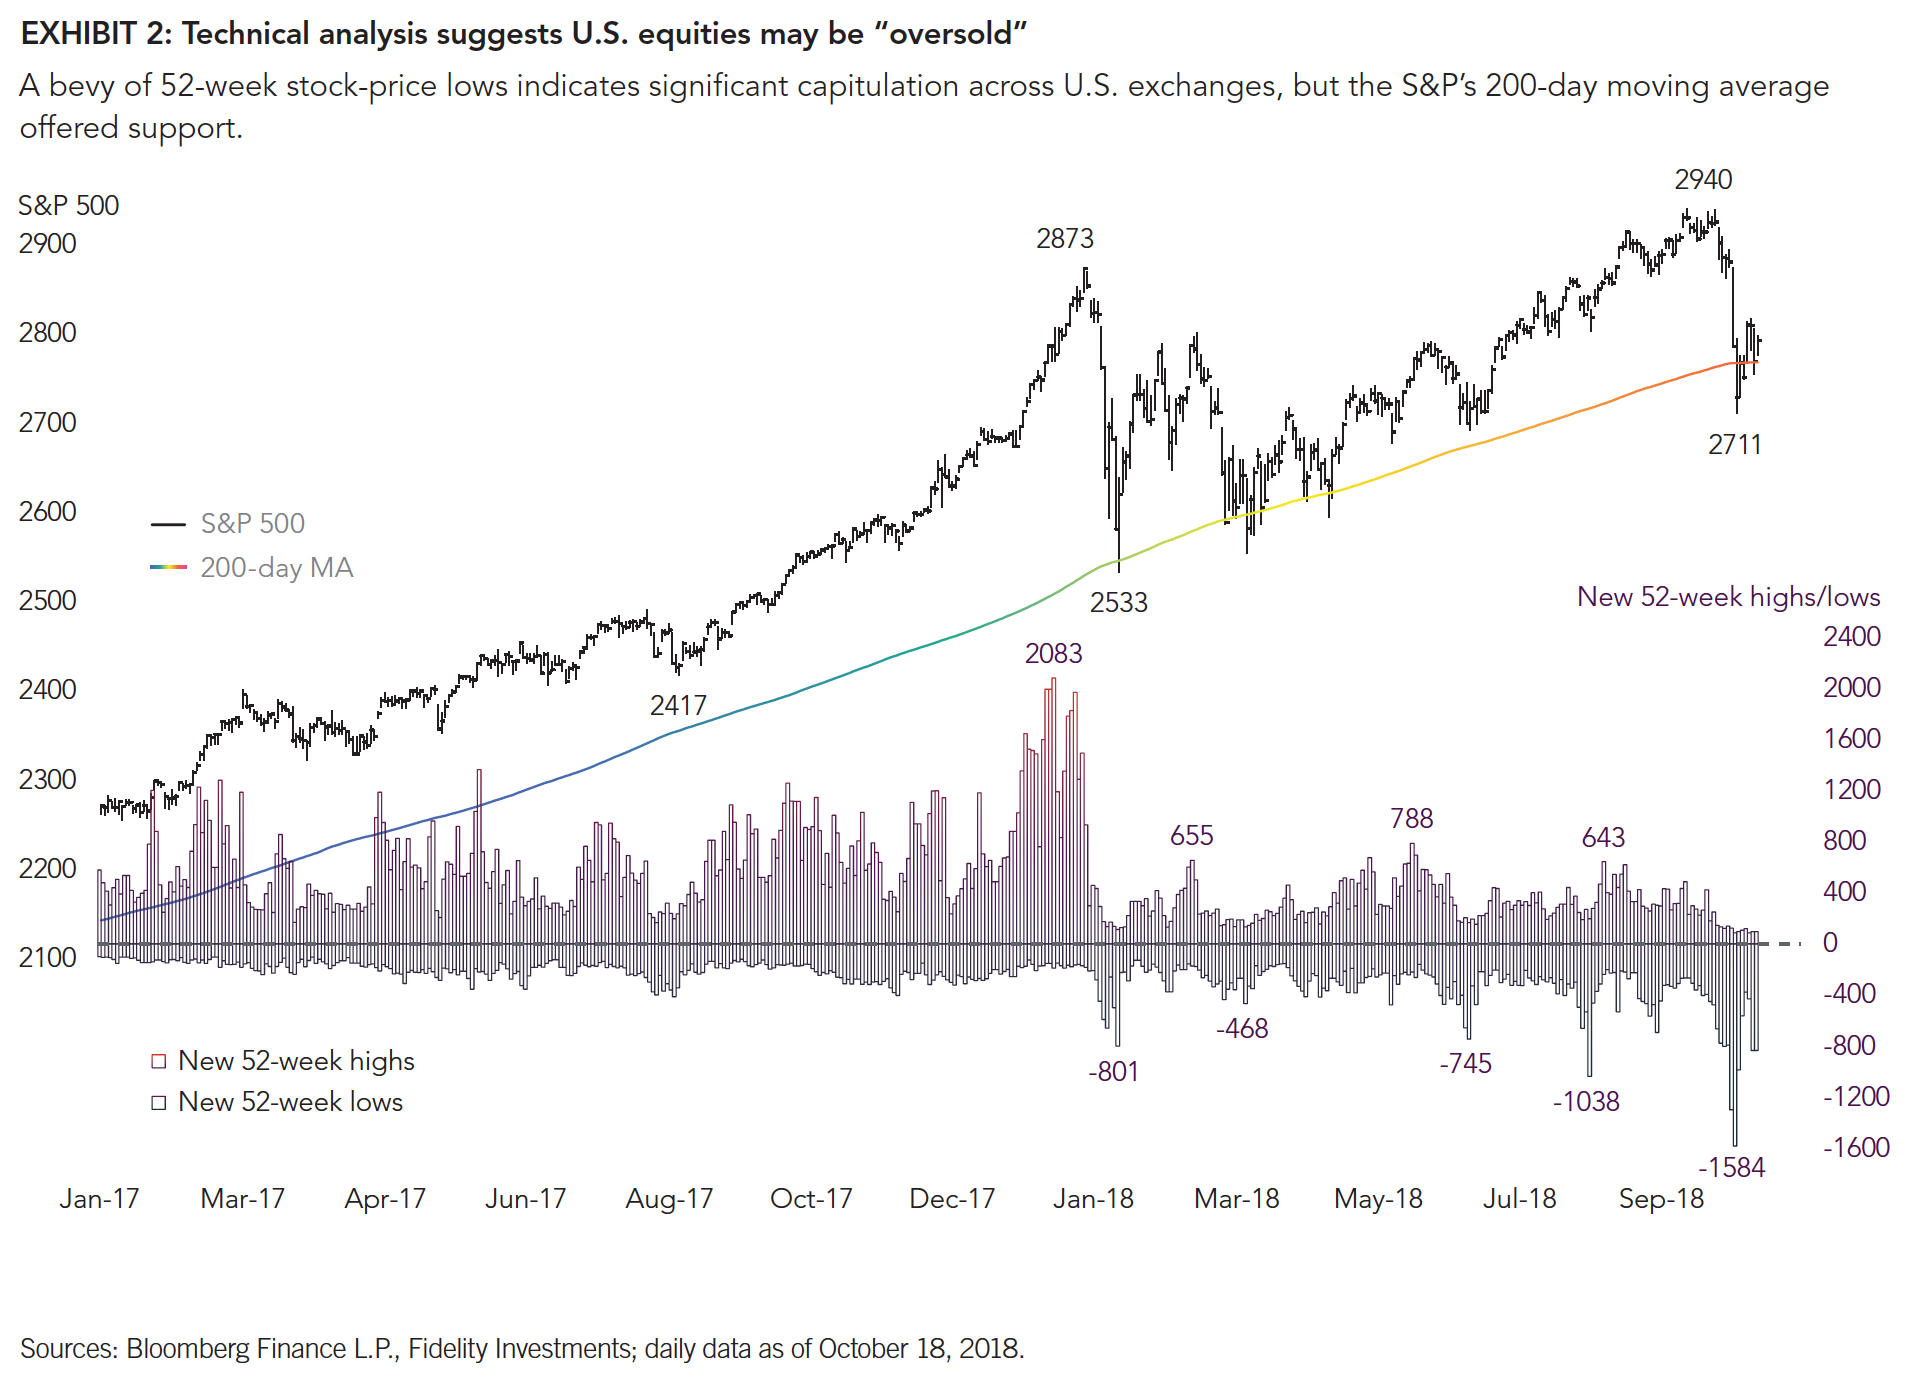
With the second derivative of the DCF numerator’s E now slowing—meaning that the earnings-growth slowdown is gathering momentum—that strongly suggests to me that the stock market is going to remain stuck in the range that it has been in all year. So, after a 10% gain in just three months, it was time to reject the old highs (around 2900) and travel back down into the trading range (Exhibit 2). Probably not all the way down to the range’s low (2550) but somewhere in the middle.
In my view, the recent sharp decline has left the market quite oversold technically (at least over the near term), so my guess is that we stabilize here. For one thing, the S&P 500 fell 230 points from its recent high of 2940 to a low of 2710 on October 11, leaving it smack in the middle of the 2018 range (2535–2940).
That constitutes a 50% retracement of the move from low to high, which is fairly standard from a technical-analysis standpoint. Also, at the October 11 low, according to Bloomberg, there were 1,584 new 52-week lows across all U.S. stock exchanges, indicating significant capitulation. In fact, the number of new lows was well in excess of the reading observed following the highly volatile 11.8% decline experienced in early February.
Finally, the S&P 500 yet again found support at the 200-day moving average, and bounced from there (so far at least). All this suggests to me that the market has regained its footing.
As scary as market volatility has been of late—and as frustrating as it is to see the market go “nowhere” for a year or longer after a massive runup—I believe this is exactly what the market should be doing based on the inescapable math of the DCF model. We are indeed at the intersection of E & r, until further notice.
Call it market purgatory.
*****
[Download]Author
Jurrien Timmer | Director of Global Macro, Fidelity Global Asset Allocation Division
Jurrien Timmer is the director of Global Macro for the Global Asset Allocation Division of Fidelity Investments, specializing in global macro strategy and tactical asset allocation. He joined Fidelity in 1995 as a technical research analyst.