Before jumping right into housing affordability, it is necessary to consider the affordability of common stocks, investor interest and initial public offerings in the early 1980s through today. Back in 1982, stocks were the most affordable of my lifetime. I can remember pitching Coca-Cola (KO) to investors in 1981-1982 at six-times earnings with a 5% dividend. Only my father and cousin bought it. There was no demand for common stocks when riskless interest rates were offering double-digit returns. There was some issuance of new companies (IPOs) and secondary offerings of existing ones, because it was prohibitively expensive to borrow money at 15-20%.
Fast forward to 1996-2000, when Federal Reserve Chairman, Alan Greenspan, coined the phrase “irrational exuberance” to acknowledge how nutty equity prices were. Price-to-earnings ratios (P/E) rose to the highest levels in our lifetimes and an enormous bubble in IPOs reached a crescendo in late 1999 and early 2000. Investors were firing stock pickers with above-average track records because their next-door neighbor was doubling their money on the latest dot-com wizardry. There was a peak in demand despite the worst affordability in 60 years. Affordability doesn’t dictate demand, demand dictates affordability. Eventually the supply of new shares from IPOs choked the stock market and it fell 40% over two-plus years.
During that same era of very high interest rates (1975-1987), when Coca-Cola was so cheap, single-family residences were historically unaffordable. This lack of affordability didn’t stop home buyers and builders from being very busy. The largest population group up to that time, the baby boomers, were buying homes to meet the demands of their growing families. Just like in stocks, affordability was not the deciding factor in the production of new homes any more than affordability drove common stock issuance.
At the height of the tech bubble in early 2000, single family residences were relatively affordable. However, the U.S. was attacked on September 11, 2001, and in the aftermath interest rates were brought down by the Federal Reserve. Single family residences became the investment of choice for boomers buying second homes and Gen-Xers buying their first or a trade-up home. Loose lending and maniacal behavior caused huge demand for homes and home builders met that misplaced demand by building the most single-family homes three consecutive years (mid-2003 to mid-2006).
This takes us to the aftermath of the financial meltdown, which had among its main causes the mania in real estate which preceded it. From 2009 to 2013, homes were the most affordable in my lifetime (60 years). As you can see from the chart below, the availability of homes for sale, coming off five years of negligible home building, was the lowest in 60 years:
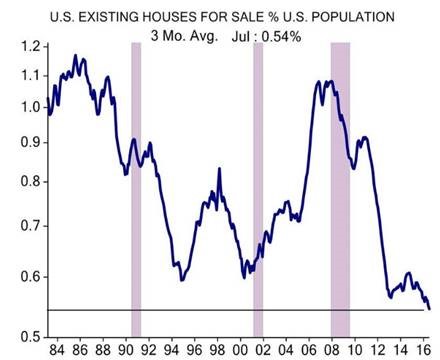
Source: ISI Group.
This chart shows that there is a severe lack of supply in homes and the owners (primarily boomers) are staying in their home much longer than prior generations. How would you have done if you bought home builders at the low points on this chart in 1994 and in 2000? The Case-Schiller chart below answers the question:
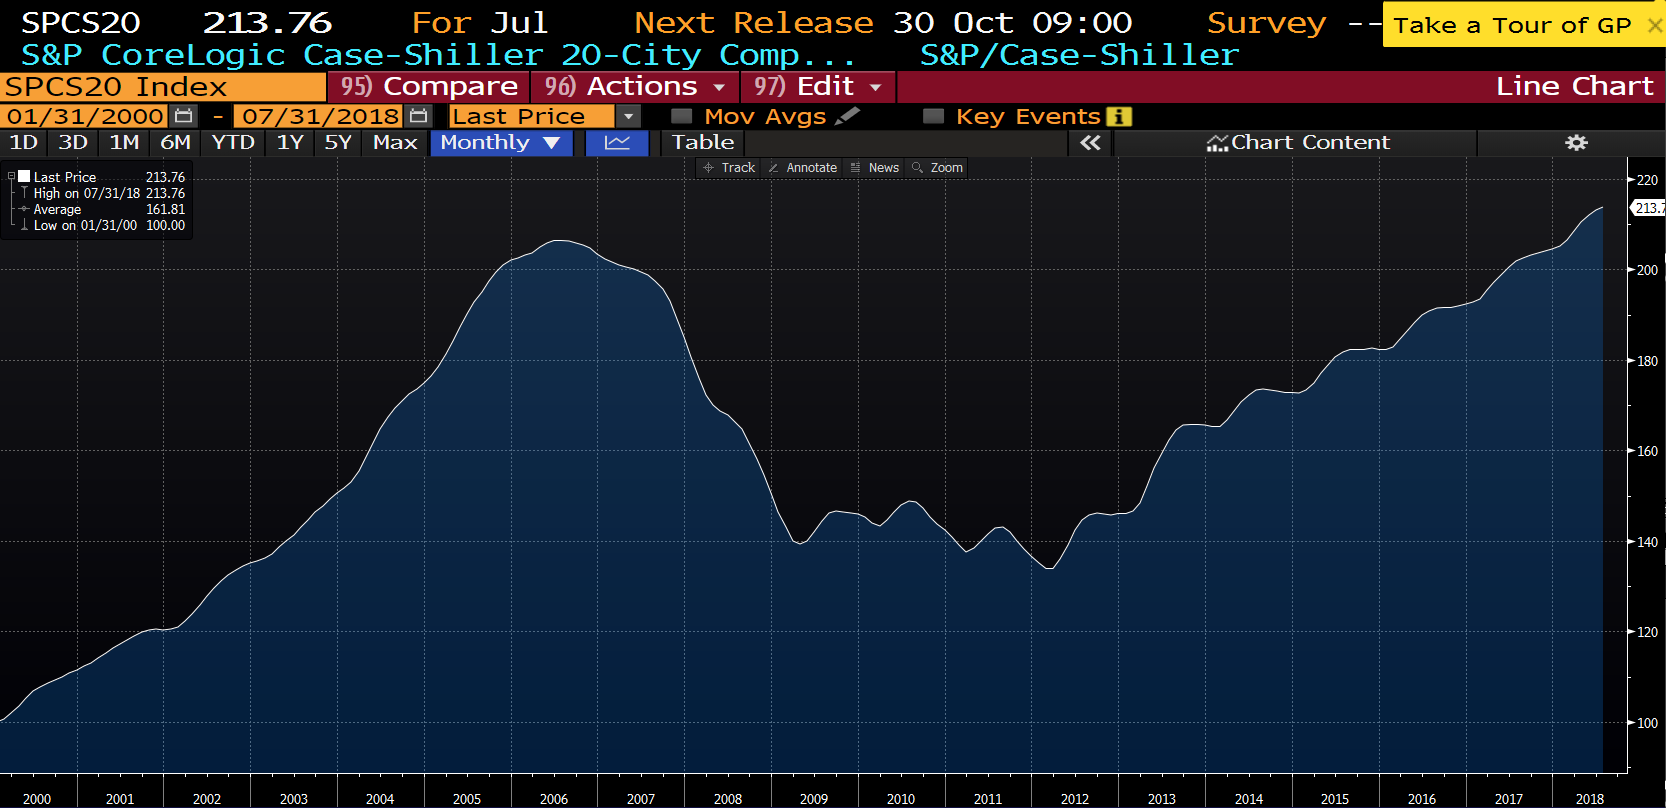
Source: Bloomberg.
On both an absolute and per capita basis, we built the fewest single family homes in 60 years in 2011. Affordability only becomes important when demand drives activity, otherwise it simply makes a good talking point. We can remember in 2010-2013 telling every young man and woman we could that this was as good a time to buy a home as has existed in my adult years. Warren Buffett wrote in his 2012 annual report for Berkshire Hathaway that if he were 25 years old, he would have purchased four homes, fixed them up and rented them. He would have done very well so far.
Watching today’s media coverage, one would think they are campaigning for this to be a cyclical top in home building and a cyclical top in prices. Their primary premise is two-fold: the demand for newly built homes is closely tied to interest rates and home price affordability. We are not mathematical geniuses, but the chart below doesn’t provide any reinforcement for their argument:
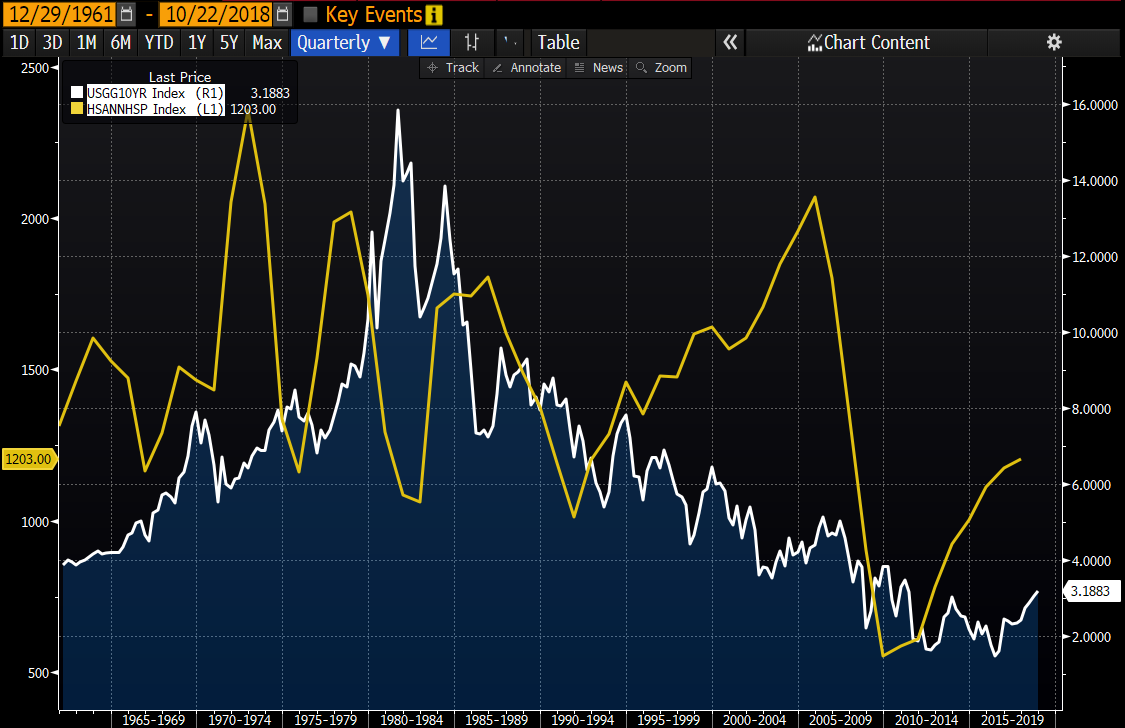
Source: Bloomberg.
In fact, the biggest home building phases outside of the 2003-2006 mania were in the early 1970s, the late 1970s and the mid-1980s. Two of those intervals peaked at ten-year Treasury rates above 10% and everything on this chart happened at mortgage rates far higher than today’s rates. What was the cause of this huge demand in the face of high mortgage rates and very unaffordable homes? We had the largest population group hitting first-time home buyer status constantly from 1970 to 1986!
The chart of housing starts versus Treasury interest rates is not population adjusted the way the prior chart was. There were 180 million people in the U.S. in the early 1960s, 225 million in the 1980s and America is approaching 330 million residents now. Don’t 330 million people need more homes than 225 million did?
Putting this all together
Among our 330 million residents are 86 million people between 24 and 42 years old, with their group peak population year at 27 years old, currently. They marry, on average, in their late twenties and early thirties and have their children between the ages of 28-40. Their full force is not yet into the housing start data. At 5% mortgage rates and with today’s level of affordability, history shows that there is nothing in the way from having a home building boom over the next ten years to satisfy this demographic demand.
We believe we could repeat the peak housing starts of the prior decades and the market share of homes built will disproportionately flow toward the large, publicly-traded home builders like NVR (NVR) and Lennar (LEN). While we have temporary softness (slower growth) in housing starts and permits, long-duration investors would be wise to catch this potential boom at prices which could very well represent John Templeton’s “point of maximum pessimism.” Look at the price charts for these two home builders:
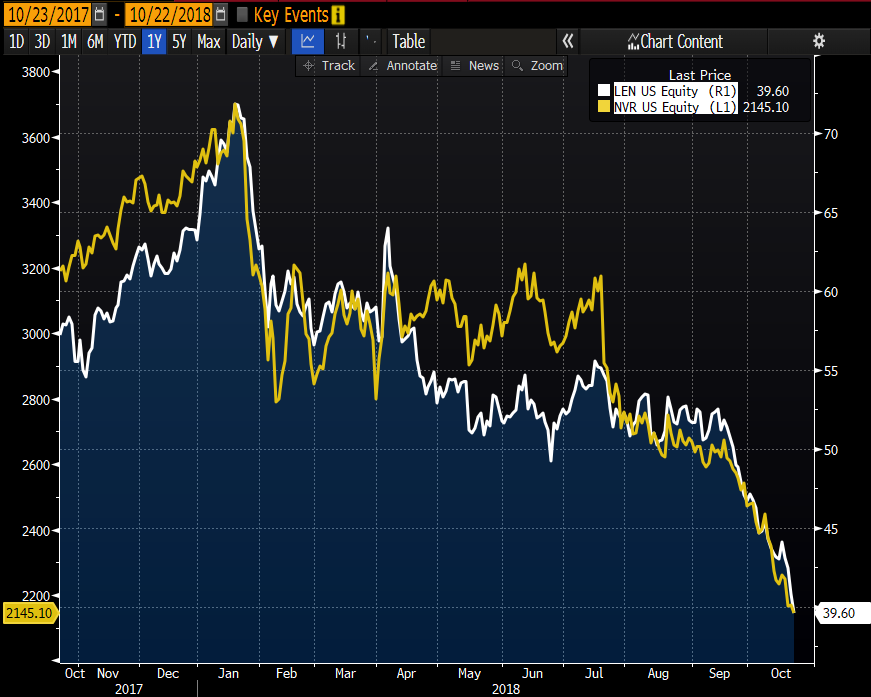
Source: Bloomberg.
As contrarians who are looking to buy the best economics at the most favorable prices, you must be lonely. As our slogan reminds us, only the lonely can play!
Warm regards,
William Smead
The information contained in this missive represents Smead Capital Management’s opinions, and should not be construed as personalized or individualized investment advice and are subject to change. Past performance is no guarantee of future results. Bill Smead, CIO and CEO, wrote this article. It should not be assumed that investing in any securities mentioned above will or will not be profitable. Portfolio composition is subject to change at any time and references to specific securities, industries and sectors in this letter are not recommendations to purchase or sell any particular security. Current and future portfolio holdings are subject to risk. In preparing this document, SCM has relied upon and assumed, without independent verification, the accuracy and completeness of all information available from public sources. A list of all recommendations made by Smead Capital Management within the past twelve-month period is available upon request.
©2018 Smead Capital Management, Inc. All rights reserved.
This Missive and others are available at www.smeadcap.com.