by Liz Ann Sonders, Brad Sorensen, Jeffrey Kleintop, Charles Schwab and Company
Key Points
- Recent stock market action reminds us how quickly things can change. It’s also a reminder that seemingly-subtle shifts in the direction of fundamental data can lead to significant moves in the markets.
- Heading into this month, markets were breathing easier over the apparent trade agreement among the United States, Mexico and Canada; however, the potential higher stakes battle continues to escalate with China, which has been one of the market risks we’ve been citing all year. Add to mix the ongoing tight labor market, and a seemingly more hawkish Federal Reserve and you had the recipe for a major pullback.
- The correlation between bond yields and stocks has shifted to an inverse relationship; both here and globally, which could be sounding a further warning sign for investors.
“It wasn’t raining when Noah built the ark.”
- Howard Ruft
Storm clouds building?
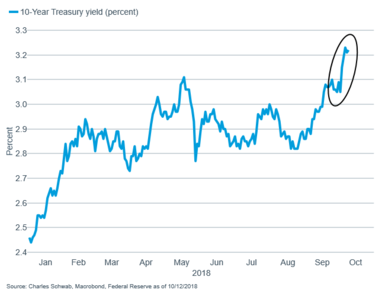
As anyone who has had the misfortune of riding out a severe storm knows, the time to prepare is before the event, not during. Likewise, preparation for inevitable market corrections should be looked at while the skies are clear, because storms can come up quickly. There were several contributors to this past week’s rout; not least being U.S. Treasury yields breaking out to multi-year highs, causing consternation among equity investors and contributing to the sharpest two-day pullback in equities that we’ve seen in months.
Yields breaking out to new highs…
…pressuring U.S. equities
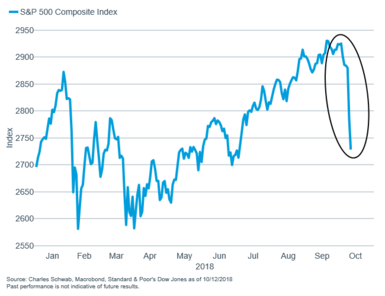
Our fixed income team doesn’t believe yields will move significantly higher from here, but investors should be prepared in the event they do (more on that below). We do believe we have passed a threshold of sorts with regard to the relationship between bond yields and stock prices. During deflationary/disinflationary periods—like the one we’ve been in since the financial crisis—bond yields and stock prices tend to be positively correlated. But once disinflation gives way to higher current and expected inflation, the correlation between bond yields and stock prices tends to move from inverse to positive. This is what we are recently seeing. We do not think this warrants that investors flee for the equity exits, but our more cautious stance over the past year keeps us in the camp of recommending that investors have no more than their normal long-term allocation to equities (hence our “neutral” rating on stocks). At a more tactical level, we recently moved to a more defensive stance from a sector perspective, and believe health care may be a good place to look for potential opportunities in the current environment, read more at Health Care: The Right Prescription?
Prior to this correction, stocks were at all-time highs; with support coming partly from the massive amount of cash being returned to shareholders by companies through buybacks and dividends. S&P reports that through the end of the second quarter, buybacks were up 49.9% from the year ago level while also setting a record for any 12-month period. Additionally, during the second quarter, dividends for S&P 500 companies totaled $111.6 billion—a new record and up over 7% from the first quarter. The rub to this market support is that it will inevitably begin to fade as we move into 2019.
But the economy still looks good!
It’s a common refrain we hear from investors who have pushed back against our more cautious stance. But we’ve seen that the best stock returns tend to come when economic data is weaker, not stronger—remember the stock market is a forward-looking mechanism. Stocks have an uncanny ability to figure out when the data is at or near its peak and just beginning to roll over (i.e., stocks tend to discount inflection points). Stocks rarely “wait” for the data to deteriorate meaningfully. For example, the chart below shows that the best equity returns have come when the unemployment rate—one of the most lagging of all economic indicators—is in its highest zone.
Stocks seems to dislike low unemployment
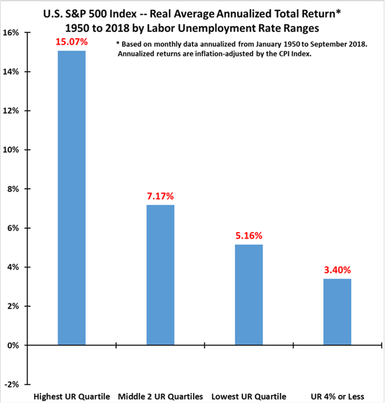
Source: Leuthold Group. 1950-2018 S&P 500 returns* by unemployment rate (UR) ranges. Past performance is not a guarantee of future results.
*Y-Axis-Based on monthly data annualized from 1/1950-8/2018. Annualized returns are inflation-adjusted by CPI.
Clearly, we are living in the far right bar presently with the unemployment rate dropping to 3.7% in September, alongside non-farm payroll growth of 134,000 jobs and prior month upward revisions of a combined 87,000 according to the Department of Labor. The unemployment rate is now at the lowest level since 1969. But stocks have been reflecting this improvement throughout the bull market; while the likelihood the rate moves significantly lower from here lessens with time.
Unemployment historically low
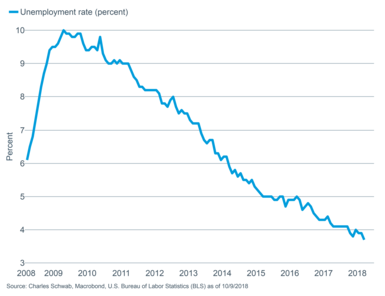
Despite the tight labor market, wage growth remains relatively contained, with average hourly earnings rising 2.8%, a tick lower than the previous month’s reading. However, several key leading indicators of future wage inflation, such as the NFIB survey noting a record number of responders reporting raising compensation, suggest the path of least resistance is higher. That’s great news for Main Street, but less great news for Wall Street as it likely means tighter profit margins along with tighter monetary policy.
But the earnings picture looks so good!
That’s another refrain we hear from investors who have questioned our more cautious stance. We don’t disagree that earnings are important drivers of stock prices, or that expectations for the upcoming third quarter earnings season are a strong 21% according to estimates from Thomson Reuters. But that’s a high bar to meet, while expectations heading into next year are for a significant slowing in growth, which could take some of the wind out of the bulls’ sails. Remember, once we move into the first quarter of next year, earnings will be compared to the first quarter of this year, which were provided a hefty boost from corporate tax cuts. Quite simply, the year-over-year growth rate math gets much more difficult in 2019.
Aside from earnings releases, we’ll also be keenly focused on corporate managements’ commentary on the impact of tariffs and trade on their outlooks. There was some relief that the old NAFTA deal was renegotiated and renamed to the catchy United States, Mexico and Canada Agreement (USMCA). The deal doesn’t look like a real game changer, but was seen as a positive in that it removed some uncertainty. But the big whopper of a trade dispute appears to be worsening. The United States and China continue to trade both harsh words, new tariffs—and in the case of China, other forms of retaliation—with little sign of improvement. We haven’t seen a large impact on the actual hard data at this point, but we’ll be listening to company executives for signs that they are pulling back on the reins given the ongoing uncertainty with regard to trade. Even in advance of earnings season, we have already begun to hear from large global companies about their concerns; and this appeared to play in to the brutal market action on Wednesday of this past week.
Fed throwing a wrench in things?
We have pointed out tighter monetary policy and financial conditions, but also the possibility of a monetary policy “mistake” from the Federal Reserve, as key risks facing the market. In a recent speech, Fed Chairman Jerome Powell noted that he thought the central bank was still accommodative, despite dropping that word from the most recent Federal Open Market Committee (FOMC) statement. Most notably though, he expressed the view that interest rates are a “long way from neutral”—indicating there could be many more hikes to come than what is currently expected. Markets heard this as a more hawkish tone and turned to worrying about the risk that the Fed goes too far and chokes off the recovery. We remain optimistic that the Fed is not on track toward more rigidity; but will remain data-dependent, flexible and cautious. However, as is nearly always the case, higher volatility as a result of monetary policy tightening is likely to persist.
Bonds and stocks part ways
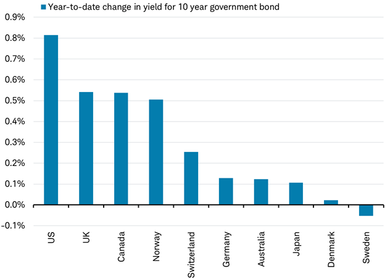
Global government bond yields have also been rising this year and not just among troubled countries. In fact, the 10-year bonds of countries with the highest (AAA) ratings have seen their yields rise so far this year, with Sweden’s small decline being the only exception, as you can see in the chart below.
Widespread rise in bond yields of AAA-rated countries this year
Source: Charles Schwab, Bloomberg data as of 10/10/2018.
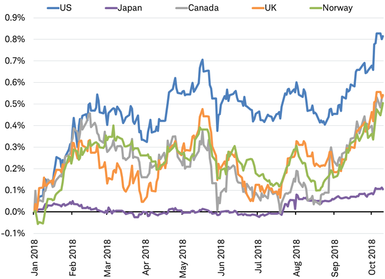
The move has been notable for its breadth—even Japan has seen a rise in yields—but not for its magnitude. Most countries have seen a rise of less than half a percentage point. Overall, yields could be nearing a peak, but it is worth noting that some have hit new highs in October, as you can see in the chart below.
Bond yields for some AAA-rated countries made new highs for the year in early October
Source: Charles Schwab, Bloomberg data as of 10/10/2018.
Why are global bond yields on the rise? There are several logical reasons: inflation has been picking up this year around the world (even in Japan); the European Central Bank (ECB) is nearing the end of its quantitative easing (QE) bond buying program as the year draws to a close; and the U.S. Fed is shrinking its balance sheet by selling some of the bonds it had acquired through its QE.
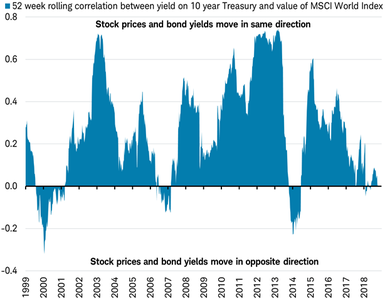
Rising bond yields aren’t always a problem for the stock market. As previously noted, yields and stock prices have often moved in the same direction over the past 20 years. But when bond yields and stock prices have moved in different directions it has been a sign of trouble. As you can see in the chart of the correlation between bond yields and stock prices below, they have moved in opposite directions three times in the past 20 years: ‘99-‘00, ‘06-‘07, and ‘13-‘14. Even though past performance is no guarantee of future results, those periods preceded global stock market declines of -18% in 2001, -42% in 2008, and -3% in 2015, measured by the MSCI World Index.
Heading to a fourth period of bonds yields and stock prices moving in opposite directions?
Source: Charles Schwab, Bloomberg data as of 10/10/2018.
The chart above also shows that the correlation between bond yields and stock prices has now fallen to around zero. If it falls further and turns negative once again it could be a signal that the global economy is beginning to overheat, sending bond yields higher while stocks slump as they begin to discount economic weakness ahead as central banks tighten policy. It may be no coincidence that these past periods of negative correlation were also the same periods the U.S. Treasury yield curve inverted (2000 and 2006-07), we believe a reliable indicator of a coming bear market and recession. For more on the yield curve see: US Bonds Have an Important Message for International Stocks.
While bond yields and stock prices could sync back up, the late stage of the economic and earnings cycle suggests that investors pay close attention to asset allocation targets.
So what?
Stock market action recently illustrates again why it’s important for investors to remain disciplined and diversified in a way consistent with their risk tolerances and investment goals. The bull market may have more legs, and upside surprises are possible, but risks have been rising over the past year or so, leading us to be more cautious and recommend that investors limit the risk in their portfolios.
Copyright © Charles Schwab and Company


