It’s not unusual for stock markets to go quiet in the last week of a quarter. Corporate news usually slows down except for profit warnings so it’s a time when no news can be seen as good news.
There have still been a number of market-moving developments this week related to trade and monetary policy but the market action related to these has been concentrated more in bonds and commodities.
The Fed announced Wednesday that it is raising the Fed Funds rate by another 0.25% to the 2.00-2.25% range. This takes the rate above the Fed’s 2.00% long term inflation and neutral interest rate target for the first time in a decade and represents a tipping point where central bank is shifting from taking its foot off the gas to starting to gently applying the brake. With the US economy growing strongly, oil prices on the rise and inflation pressures building, additional rate hikes over the next year appear likely.
Highlights of the Fed statement and member projections included:
1) The FOMC removed the word “accommodative” from the statement, indicating an end to the last decade of easy money. It also referred to its 2% inflation objective as symmetric, opening the door for a return to old school monetary policy where a central bank raises or lowers rates as needed.
2) The Fed raised its 2018 GDP forecast to 3.1% from 2.8% and edged up its 2019 GDP forecast to 2.5%
3) The bulk of Fed members are expecting one more rate hike this year (December most likely) and then 2-4 increases in 2019 which would take the Fed funds rate up into the 3.00% to 3.75% range after which members expect rates to level off. Markets took this outlook in stride indicating it in line with broad expectations. All bets are off, however, if the price of oil or other commodities take off and inflation pressure keep increasing.
In this issue of Equity Leaders Weekly, we take a look at the causes of rising US interest rates and their implication on the outlook for stocks. We also examine renewed interest in energy commodities, particularly this week’s breakout by Brent Crude.
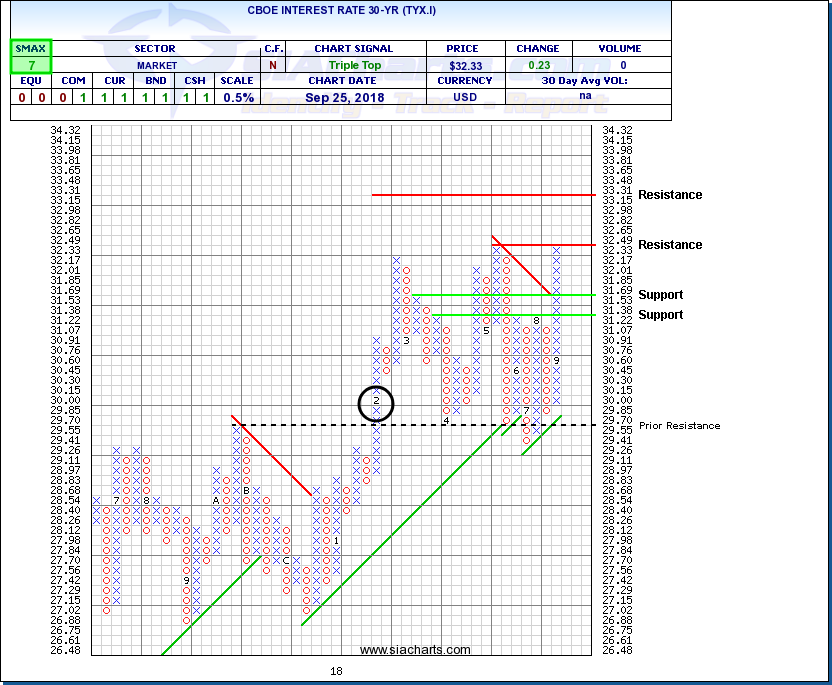
CBOE Interest Rate 30-Year (TYX.I)
Moves in the US 30-year interest rate have had a significant impact on US stock markets in 2018. The breakout over 3.00% back in February (circled) for example, sparked a big selloff in US stocks including a 1,000-point intraday point plunge in the Dow. US markets remained choppy through to when TYX.I peaked in May then rallied to new highs when the 30-year yield fell back in the summer.
In recent weeks, TYX.I has started to climb once again. Increasing US interest rates could be due to a number of factors including a strong economy boosting interest rate expectations, and possibly China starting to sell some of its enormous US Treasury holdings as trade tensions between the two countries continue to escalate.
A breakout over 3.13% completed a bullish Triple Top pattern and the rate has climbed to retest its May high. A breakout over 3.25% would signal the start of a new upleg for US rates, and also could spark another selloff in US stocks, which have sidestepped the late summer declines seen in other regions of the globe. Next potential resistance near 3.31% based on a double vertical count from the winter breakout pole, while the dot plot suggests that a move past 3.50 looks unlikely in the foreseeable future.
Should the 30-year rate remain below 3.25% or even drop back toward 3.00% again, it could be supportive for indices continuing their bull market uptrends, particularly if the US continues to be seen as one of the few islands of stability in a volatile world.
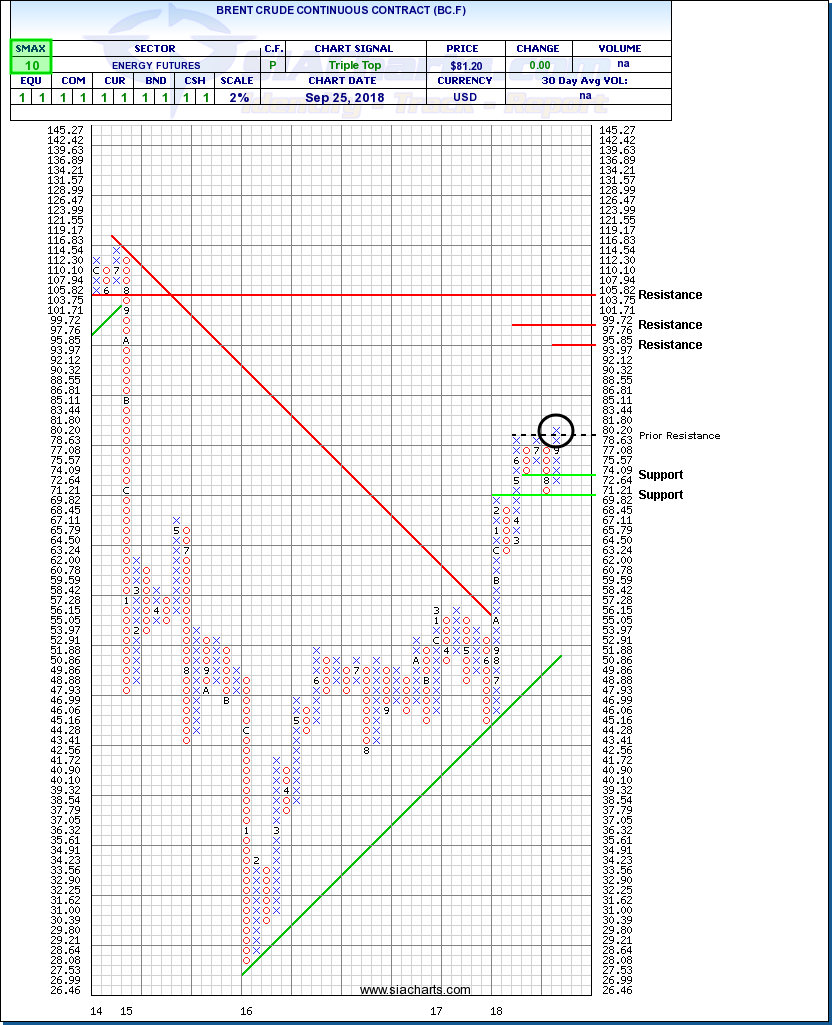
Brent Crude Continuous Contract (BC.F)
Another consequence of a strong US economy combined with rising foreign policy tensions is that oil prices have started to climb again. Demand for oil, particularly from the US, remains strong but the outlook for supply has been capped with Saudi Arabia and Russia looking to offset the decline in Iranian exports due to new US imposed sanctions.
Oil contracts spent the summer digesting their spring rally with WTI trading between $65.00 and $75.00 per barrel and Brent trading in the $70.00 to $80.00 per barrel range. This week, Brent has broken out to the upside, completing a bullish Triple Top to trade at its highest level since 2014. A perfect SMAX score of 10 indicates that Brent Crude is exhibiting near-term strength across the asset classes.
With a new advance underway, a horizontal count from the recent consolidation range suggests potential resistance near $95.85, while a double vertical count from a previous breakout suggests potential resistance near $99.75 or even $100.00 a round number that has been bandied about in the press this week. Initial support moves up toward $72.65.
SIACharts.com specifically represents that it does not give investment advice or advocate the purchase or sale of any security or investment. None of the information contained in this website or document constitutes an offer to sell or the solicitation of an offer to buy any security or other investment or an offer to provide investment services of any kind. Neither SIACharts.com (FundCharts Inc.) nor its third party content providers shall be liable for any errors, inaccuracies or delays in content, or for any actions taken in reliance thereon.