by Tony Scherrer, Smead Capital Management
“Two roads diverged in a wood, and I—
I took the one less traveled by,
And that has made all the difference.”
– Robert Frost
We have written profusely about the investment myopia of today which has focused on “growth at any price companies” without regard to profits or free cash-flow. We do this because we know success in investing requires a healthy degree of discomfort for it to be profitable, and we know how much comfort today’s investor has found by owning what has worked.
These later stages of a mania do a good job of wearing down even the most ardent apostate. For many, it becomes natural to yield to the tunnel vision thinking which Sir John Templeton says leads to the four most-expensive words in the English language, “this time it’s different.”
One important preventative cure to defend from this type of financial euphoria is memory. We need to remember the larger picture of market history, yet we don’t need to look too far back for useful perspective. Money flows are one prism to see where past manias went parabolic and then fizzled out, and recent examples remind us of Robert Frost’s “two roads” that diverge in the woods.
Consider 2011, where the market became surrounded by thick “woods” in very tall forests. The S&P 500 lost 19.4% from the April peak until the October trough. Like today, the world became fixated on the idea of a recession (double-dip in that case) and the end of the anemic economic expansion. Money flowed heavily into the “fear-trade” and “flight to quality” ideas. The 10-year Treasury bond yield took a swan dive from 3.74% to 1.72%, causing the bond price to spike up 18.5%. Gold had one of the more spectacular moves it has ever had, appreciating an eye-popping 45% intra-year and attracted massive amounts of money into the yellow metal.
As gold peaked above $1,900 an ounce (today it is around $1,200), the SPDR Gold ETF (the most popular vehicle utilized to “invest” in gold) vacuumed up more money than any other ETF in the world. By late August of 2011, it captured $77.5 billion in assets, about $1 billion more than the S&P 500 SPDR which tracks the broad stock market. As of today, the Gold ETF has around $28 billion in assets, and the S&P 500 SPDR ETF has $270 billion. Divergent roads were taken, and the crowd was proven woefully wrong. Despite the best advertising efforts of G. Gordon Liddy and singer, Pat Boone, the mania was over. The portfolios of enthused gold bugs were crushed. Taking the road less traveled would have made all the difference.
The year 2008 had similar capital misallocation. First, the enthusiasm swirling around China’s world economic dominance captured investors’ imaginations worldwide. Second, and simultaneously, oil-promoters sold the world on “peak-oil theory,” causing a feverish investor frenzy. The peak-theory promotion worked to get WTI oil to all-time highs of $145 per barrel by July of 2008, only to lose nearly 77% before year-end when it touched down under $34 per barrel. The crowd was wrong on China too, as the Shanghai Shenzhen CSI 300 Index sits at ¥3,202 today, 45% below its high of ¥5,877 eleven years ago. Where are the new 500 million “middle class citizens” when you really need them?
A strong market theme in 2018 includes the fears of economic slowdown or moderation. Look no further than our homebuilders, banks, media companies or consumer-oriented businesses as evidence. Investors have gotten off the road of believing in a continued broad economic recovery and given way towards piling increasing amounts of capital into stocks (mostly tech-related) that have worked. Here is the chart of the assets under management of the most popular tech ETF, the XLK (Technology Select Sector SPDR Fund), from the start of the bull market in 2009 until today:
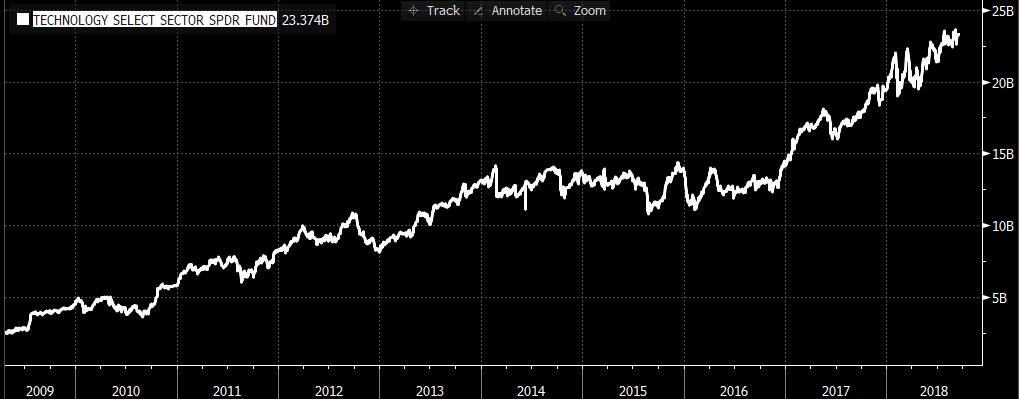
Source: Bloomberg.
The assets have more than ten-folded over that timeframe, outstripping the broad market several times over. The FAANG-powered ETF, the QQQ, has gathered even more attention as we pointed out in last week’s missive. Here are the top-10 holdings of the QQQ near the beginning of the bull-market (April 22, 2009, on the top) vs. today (bottom):
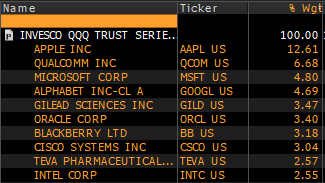
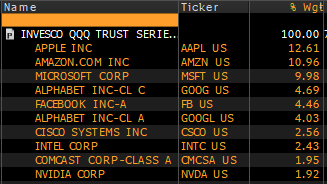
Source: Bloomberg.
The total of the top-10 holdings in 2009 accounted for 46.99% of the QQQ ETF. Today, those same names account for less than 33.98%, and several aren’t represented at all (BB, TEVA and ORCL). Do today’s top-10 (on the right, summing to 55.59%) look like an extreme to you? Do you want to take that road? Do market participants realize they already are on that road by simply owning the broad market? This may not be G. Gordon Liddy or Pat Boone advertising gold, but the promoters of the largest tech ETFs and broad passive vehicles are blanketing the financial networks with advertisements just the same!
We find it odd that the economic doubters have a similar attitude to the one they had in 2011, despite ample evidence suggesting Main Street is getting better, not worse. We are seeing more participants in the labor force, increasing wages, low unemployment, higher median household incomes and very low rates offered by a healthy banking system. This is standing in front of a massive generation of Americans (ages 23-41) that are in the early stages of taking on mountains of debt as household formation activity dictates.
The mania for oil in 2008 and gold/safety in 2011 are great for remembering because it puts today’s myopia in perspective. What investors get infatuated with is historically fickle, and history shows that it has paid to choose the road less traveled. Currently, investors are extremely committed to the XLK and the QQQ ETF’s, which give them participation in the market’s most popular stocks. We will reignite our market-memories and utilize our investment discipline to tack away from this excitement. We believe it could make all the difference in forward-portfolio results!
Warm regards,

Tony Scherrer, CFA
The information contained in this missive represents Smead Capital Management’s opinions, and should not be construed as personalized or individualized investment advice and are subject to change. Past performance is no guarantee of future results. Tony Scherrer, CFA, Director of Research, wrote this article. It should not be assumed that investing in any securities mentioned above will or will not be profitable. Portfolio composition is subject to change at any time and references to specific securities, industries and sectors in this letter are not recommendations to purchase or sell any particular security. Current and future portfolio holdings are subject to risk. In preparing this document, SCM has relied upon and assumed, without independent verification, the accuracy and completeness of all information available from public sources. A list of all recommendations made by Smead Capital Management within the past twelve-month period is available upon request.
© 2018 Smead Capital Management, Inc. All rights reserved.
This Missive and others are available at www.smeadcap.com.