by Liz Ann Sonders, Brad Sorensen, Jeffrey Kleintop, Charles Schwab and Company
Key Points
- The traditional “quiet” summer period has been absent as the trade skirmish, tighter monetary policy, and political wrangling persist. Markets continue to shrug off the concerns, with volatility in stocks, bonds and currencies all among the lowest in 25 years; but some caution is warranted.
- Actual earnings results may be taking a back seat to forward-looking commentary surrounding capital spending, and the possible hit from rising trade tensions.
- Central banks remain in focus globally, with yield curves being closely watched. The Fed has expressed little concern but financial conditions are tightening, which has implications for markets.
“Rest is not idleness, and to lie sometimes on the grass under the trees on a summer’s day, listening to the murmur of the water, or watching the clouds float across the sky, is by no means a waste of time.”
- John Lubbock
No time to watch the clouds
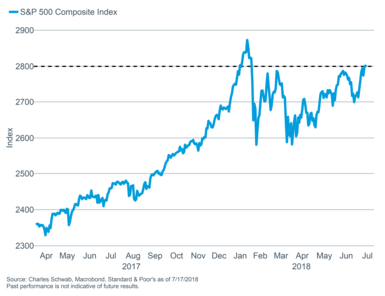
Many investors must have had a similar experience to us over the past several weeks—having family members get irritated that stock markets demanded attention in the midst of what was supposed to be a vacation. The traditional summer doldrums have yet to hit as the news flow continues to be heavy; however, significant up or down daily moves in stocks have been in a descending pattern since the February correction. Despite rising concerns surrounding trade, political wrangling, and Fed tightening, stocks are near the top of the recent trading range. Even with the move higher, however, we are becoming a bit more cautious and recommend that investors not chase the rally by moving out the risk spectrum; but remain patient, disciplined and diversified.
S&P to the top of the range, finally retaking the 2800 level
We remain in the secular bull market camp but maintain that any persistent upping of the antes by the United States and its trading partners with regard to tariffs and retaliations is a cyclical risk. One benefit of the trade uncertainty is that it’s allowed investor sentiment to move back into neutral territory from overly optimistic territory, according to the Ned Davis Research Crowd Sentiment Poll.
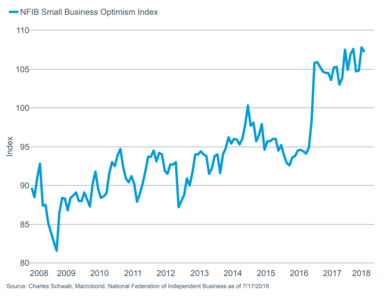
The latest round of proposed tariffs won’t go into effect until September at the earliest, leaving time for negotiations; however, there’s little indication that any serious negotiations are actually underway. And last week, President Trump again threatened to impose tariffs on cars and auto parts—which would represent a meaningful expansion of global trade tensions. There is some hope that political and economic conditions in Europe will support negotiations between those countries and the United States. France and Germany are facing political difficulties at home, with German Chancellor Angela Merkel facing a challenge to her leadership and French President Emmanuel Macron facing an approval rating drop to the lowest level of his term according to the Financial Times. Business (and consumer) confidence has held up in the United States; although the National Federation of Independent Business (NFIB) small business optimism index dipped in June (to a still-high level) and capital spending outlooks deteriorated within several regional Fed surveys. At the same time, confidence readings globally have rolled over more noticeably.
US business confidence remains elevated
While some foreign regions have taken a hit
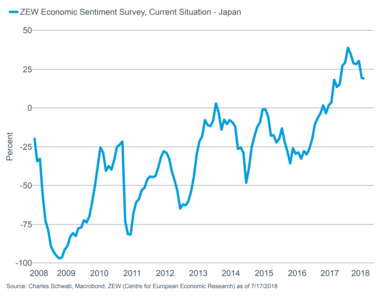
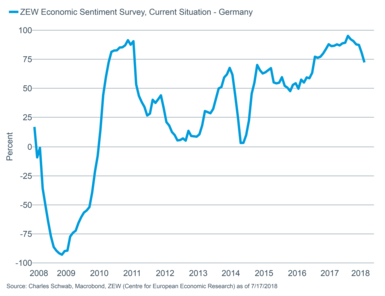
This deterioration in confidence could make foreign countries, other than China, eager to move past the trade disputes.
Corporate earnings news fights for attention
Earnings season has not yet been given its traditional high billing in terms of investor attention. Consensus expectations were high coming into earnings season and there’s no reason to think companies won’t hurdle that bar; but what may be of more interest is the level of trade-related concern business leaders express; and the amount of capital spending and/or investment they may put on hold in the face of the that uncertainty.
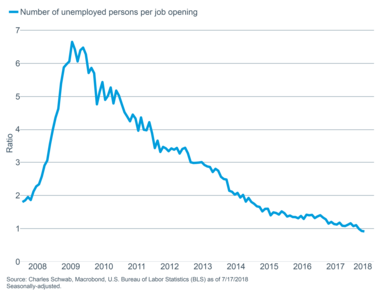
More broadly, the Atlanta Fed’s GDPNow forecast for second quarter real gross domestic product (GDP) growth is at a lofty 4.5%; at the top end of the Blue Chip consensus range. In addition, for the first time in the history of the Job Openings and Labor Turnover Survey (JOLTS) (although the data only goes back to 2001), the number of available jobs is greater than the number people unemployed. Economic strength and the tightness of the labor market suggests some corporate spending can no longer be put off.
Lack of available workers may force business spending
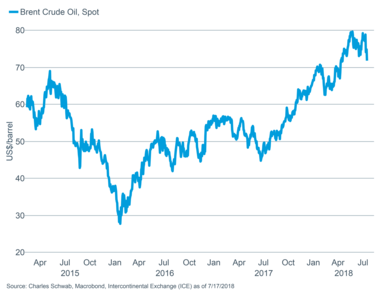
So far in second quarter earnings reporting season, results have largely been better than expected, with the “beat rate” running near 86%. However, like during the first quarter, beats have been only modestly rewarded, while misses have been more severely punished, further illustrating the high level of expectations coming in. As earnings season progresses, we will also be watching for mentions of cost increases to companies as they deal with higher wages, higher energy prices, and potential higher costs due to tariff increases.
Higher energy prices could raise costs
No beach time for the Fed
If it makes you feel any better, the Fed has likely had little time to relax either, with their plans of a slow normalization facing questions from both the hawkish and dovish sides. In the release of the minutes from the most recent Federal Open Market Committee (FOMC) meeting, several officials expressed concern that the trade disputes could result in a slowdown of corporate activity—potentially putting in place a reason to consider reining in rate hikes. But with the aforementioned labor market tightness and upward pressure on inflation, market expectations remain high that we will see two additional rate hikes this year. The likelihood of higher inflation to come is illustrated in the chart below, which shows the relationship between a newer (and broader) measure of inflation constructed by the New York Fed—the Underlying Inflation Gauge (UIG)—and the more traditional core Consumer Price Index (CPI) and core Personal Consumption Expenditures (PCE) measures of inflation.
Inflation rising
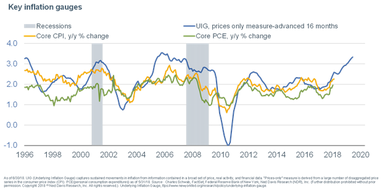
We agree with the consensus of two more hikes this year; but in his recent testimony before Congress, Fed Chairman Jerome Powell indicated the “autopilot” style of rate hikes are likely coming to an end. Incoming economic and inflation data will influence their actions to a greater degree, which could lead to more uncertainty regarding monetary policy for the remainder of this year.
Yield curve watch
Powell also expressed little concern about the yield curve—despite the elevated focus by investors and media pundits. Although every variety of yield curve has flattened this year, recession risk remains low for now. Even an inversion, which is likely coming, doesn’t necessarily signal impending doom for the stock market or economy—there are variable and sometimes fairly long lead times between inversions and trouble.
Market expectations and central bank expectations for the path of policy rates are not always aligned. In the past, the market has tended to be a more accurate gauge of policy action than the policymakers themselves, but it is certainly not infallible when it comes to forecasting. The chart below shows us what the market currently believes about the path of short-term rates among major countries.
What the market thinks about the path of short-term rates
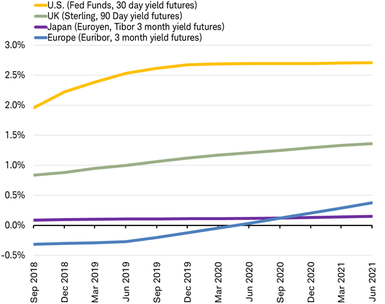
Source: Charles Schwab, Bloomberg data as of 7/18/2018.
- U.S. Federal Reserve: While the average of the individual members of the Fed believe they will hike rates five to six more times this cycle, the market thinks just three; with the fed funds rate levelling off at 2.75% (three hikes of 25bps hikes from the current 2%).
- Bank of England: The market expects a rate hike again next month, but doesn’t anticipate a rapid path of rate hikes before the Brexit path is clarified.
- Bank of Japan: No short-term rate hikes are expected by the market in the near-term, but the target rate for the longer-term 10-year bond may be increased to 0.1% from zero.
- European Central Bank (ECB): The market expects rate hikes to begin in a little over a year with a steady path of hikes to follow. The ECB is widely expected to end QE (quantitative easing) at the end of this year.
- Bank of Canada: The market expects a continuation of the path of raising rates that began a year ago according to Bloomberg.
- Reserve Bank of Australia: The market expects the first rate hike since the financial crisis to take place within the next six-to-12 months according to Bloomberg.
Most of the rest of the world’s central banks are on hold, but some have shifted toward rate hikes this year. The first half of 2018 saw the highest percentage of central banks hiking rates in any year since 2011. We haven’t seen this small of a percentage of the world’s central banks cutting rates in 12 years.
2018 reveals smallest percentage of central banks cutting rates in 12 years
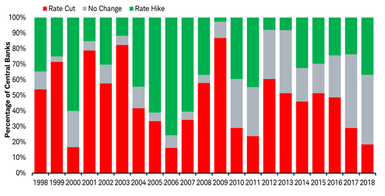
2018 numbers are through June 30 2018.
Percentages based on study of 38 central banks.
Source: Charles Schwab, Bank for International Settlements (BIS) data as of 7/18/2018.
Why the broad shift by central banks now? Global growth is solid and inflation is on the rise. In fact, last week the International Monetary Fund (IMF) released their World Economic Outlook update—raising its inflation outlook for 2018 and 2019 to above 2% (2.2%) for advanced economies, and 4.4% for emerging markets. If central banks don’t raise rates to keep up with the rebound in inflation, real (inflation-adjusted) rates will fall and provide more fuel to the economy and prices.
What do higher short-term rates mean for stocks? In the near-term, higher short-term rates don’t necessarily push stocks lower. While past performance is not an indication of future results, over the past 20 years, the statistical correlation between the fed funds rate and the U.S. stock market has been close to zero (0.057). A similarly uncorrelated relationship can be seen around the world between stock markets and their country’s central bank policy rates. We can see this evidenced during past two-and-a-half years of rate hikes in the United States, and past year of hikes in Canada, during which their respective stock markets rose. Instead, rate hikes have tended to correlate with higher volatility; as you can see in the chart below of the net number of central banks hiking interest rates and the VIX, or volatility index.
Over the intermediate-term, more rate hikes may cause yield curve inversions, which would raise the risk of a global bear market, and increase the likelihood of a global recession. Central banks will remain a key focus of investors in the second half of 2018 and throughout 2019.
So what?
Rising trade tensions are making us a bit more cautious, although the economic and earnings fundamentals remain healthy, which could cushion some of the blow from a trade war. Stay invested, but don’t reach too far out the risk spectrum, be prepared for bouts of volatility, and remain patient, diversified and disciplined.
Copyright © Charles Schwab and Company


