
When most investors think of risk, equity market risk most often jumps top of mind. For an equity portfolio, fund or investment product, if the market declines by x%, by how much can you expect the investment to decline? And there are many popular performance-based measurements of this kind of risk. Standard deviation is likely the most popular, measuring the volatility of returns over a period. Downside deviation, a slightly different iteration, measures just the volatility of negative returns over a period. After all, if the investment goes up 10%, is that really risk? Up and down market capture can provide insights. This calculates the average up market capture when the market moves higher and average down-market capture when the market moves down. Then there is correlation, not really measuring the magnitude but more the direction of the investments performance-based on which direction the market is moving.
All of the above risk metrics, while insightful and useful, are only really capturing or quantifying how much equity market risk an investment contains. But, much like the rainbow has many colours, risk too comes in many forms with equity market risk only being one of them. In the following paragraphs, we will share other kinds of risk that may not be as popular but are becoming more important for investors. And new methods for calculating or quantifying certain risks.
Beyond Equity Market Risk
When it comes to building and/or managing portfolios, only focusing on equity market risk can actually be dangerous. For instance, investments that are lower in equity market risk can often have higher risk from other factors or exposures. Understanding how trading one risk for another, which may still be beneficial for a portfolio, still has other risks that should be acknowledged. The following are a few types of risk that go beyond simple market risk that investors should consider.
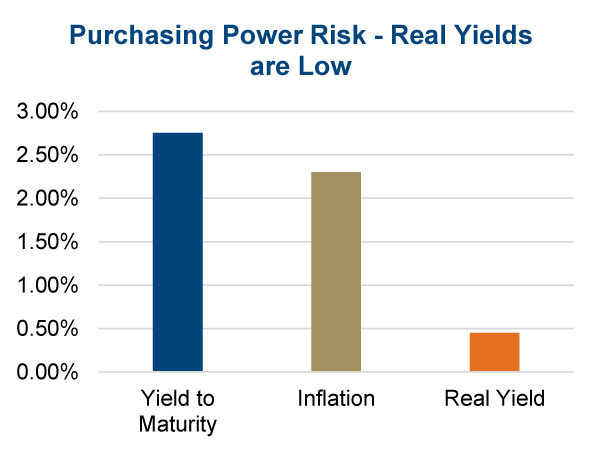
Purchasing Power Risk – Even though inflation is low, running about 2.3% in Canada, this is a risk since bond yields are also low. Adding bonds to a portfolio certainly reduces the overall equity market risk, but it does increase the purchasing power risk, losing purchasing power over time. The Canadian bond universe has a weighted yield-to-maturity of 2.75%. Which means if inflation remained stable, you would earn 0.45% in real terms (chart). If inflation rises or you invested in shorter duration bonds that have a lower return, you are likely trading equity market risk for inflation or losing purchasing power over time.
Credit Risk – There was a time, not that long ago, when individual investors used to own government bonds as a core component of many portfolios. As bond yields fell, investors turned to provincial bonds, then to investment grade corporates, then to high yield corporates, and now to investments in bank loans, microfinance, mortgages, etc. This slide down the credit curve over the past decades in search of yield has resulted in many portfolios containing a much higher credit risk than decades past. While not necessarily a bad thing, this is a risk unlike equity market risk that should be considered.
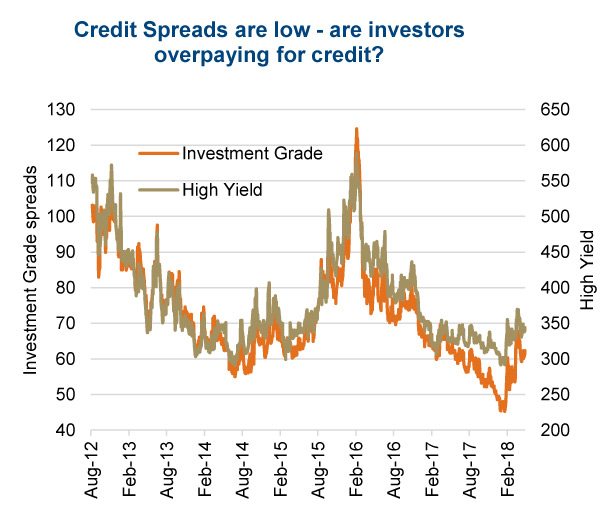
With credit spreads being historically low (yield on investment grade or high yield bonds over government bonds), it does raise the question whether investors are being adequately compensated for taking on credit risk (top chart). In addition to low spreads, the current bull market is now over eight years old and should a recession be on the horizon, credit exposure may become a more pertinent risk.
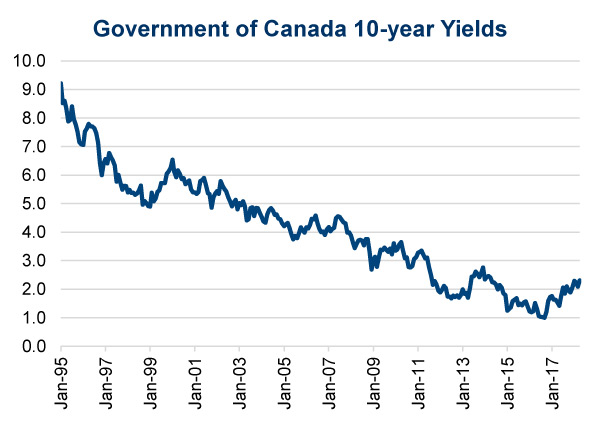
Interest Rate Sensitivity Risk – This is a relatively new type of risk for many investors as bond yields have been steadily declining over the past few decades. However, after bottoming in 2016, yields have been trending higher, thus impacting more interest rate sensitive investments (2nd chart). Bonds fall into this category but so do many dividend paying equities. Yields, once a tailwind for utilities, telecom companies, pipelines and real estate companies, are now becoming a headwind. Divergence among dividend strategies this year have been notably driven by their respective sensitivity or risk to changing rates/yields.
Dividend focused strategies, which have historically experienced lower equity market risk, have a higher interest rate sensitivity risk. Should yields continue to rise, this risk is becoming more impactful on performance. The advent of some ‘low volatility’ strategies that focus on equity investments with historically lower equity market risk have actually traded this risk for interest rate sensitivity risk.
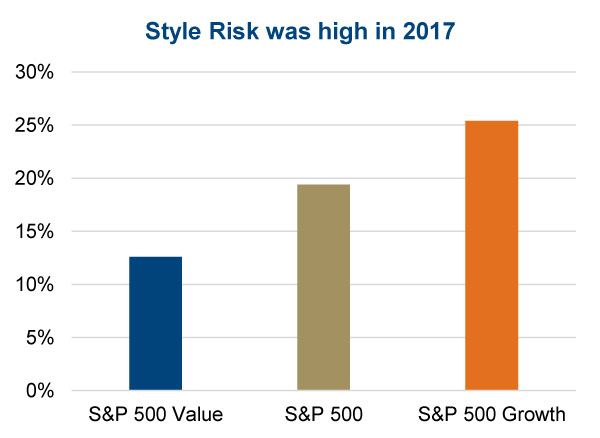
Sector or Stock Selection Risk – Investments that are very concentrated in a sector or limited number of sectors are at risk should that sector fall out of favour. Style-based investing has greater sector selection risk. For instance, Growth outperformed Value substantially in 2017 based on the S&P 500 style indices. Tilts in a portfolio that focus on one style may reduce some types of risk but elevate sector or style risk. Just ask any value manager these days.
This is also evident in portfolios that focus on only a few securities. Or long/short alternative strategies. A long/short fund goes long some companies and short others, which certainly reduces equity market exposure risk, since if the market falls, the shorts will help offset the broader market risk. However, this strategy trades market risk for stock selection risk. The longs need to go up while the shorts need to decline. Clearly which stocks are long or short become the key risk driver.
Measuring Risk – Beyond Standard Deviation
Factor-based risk measurements are becoming more popular. Not just to quantify risk but also to understand the exposure in a portfolio. These can include factors such as growth, value, momentum, leverage, size, variability, dividends and variability to mention a few. Risk is not a bad thing, not knowing the risk a portfolio or investment is subject to is. Factor analytics can help isolate the exposure from stock, style, currency, and interest rate sensitivity.
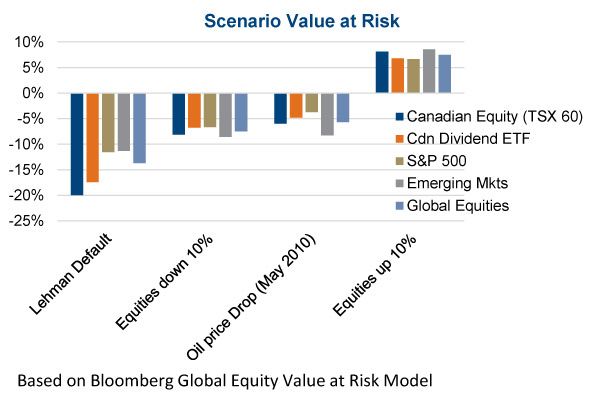
Another approach that is useful is scenario analysis. Events that happened are not going to repeat but understanding the variance in how different investments perform under different scenarios helps investors understand their risk. Bloomberg uses a Global Equity model which can measure the estimated value at risk under past key events. This can help differentiate the risks between investments. Understanding these differences, can help managers and advisors build better quality portfolios.
Investment Implications – Investing is all about risk, managing the appropriate level of risk to meet your long-term investment objectives. However, risk goes well beyond simple equity market risk, and understanding the other types of risk is critical for managing portfolios. Risk isn’t a negative, if there were not risk there would be no return either.
However, the more we can understand and quantify other risks, in addition to market risk, the less likely we will be surprised. Surprise risk, one to which you didn’t think you were exposed, is by far the worse risk out there.
Copyright © Connected Wealth, Richardson GMP