This week in the SIA Equity Leaders Weekly, we are going take a look at the S&P 500 index (SPX.I) as it U.S. Equity markets have had a hot start to 2018 keeping the momentum of 2017 going. We will also take a look at the Chinese market that continues to lead the way in International Equity markets as a strong outperformer that has over doubled the U.S. Equity's strong start to 2018.
S&P 500 Index (SPX.I)
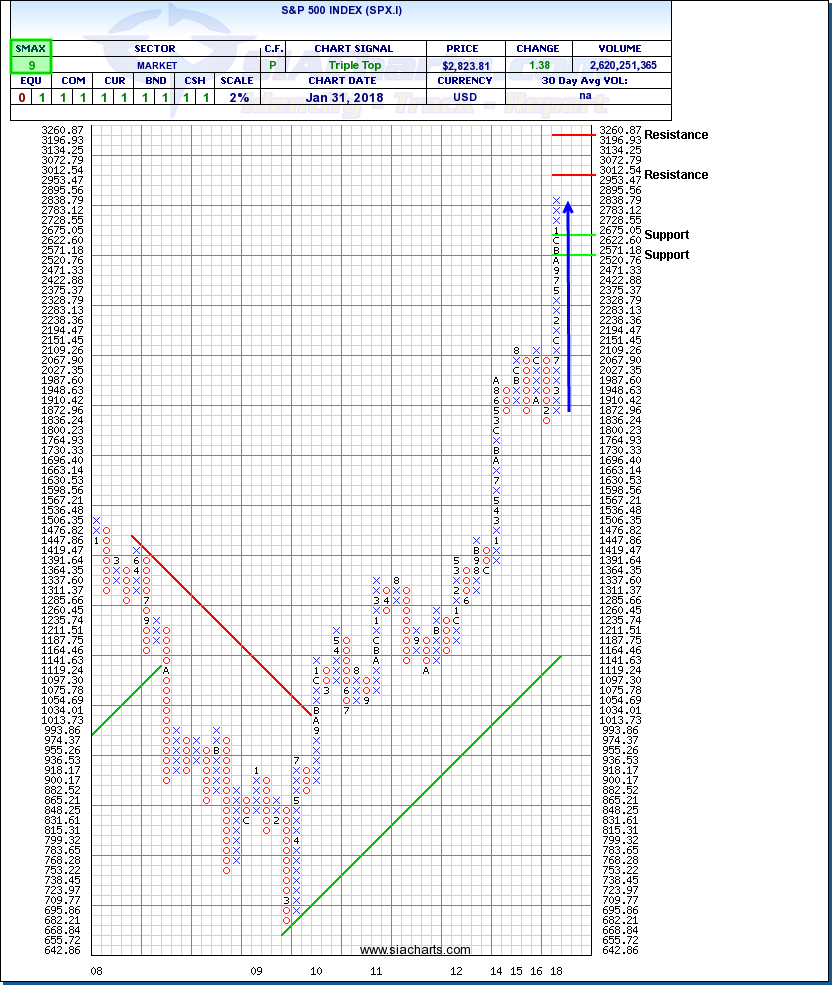
The SIA Equity Action Call remains in the Green Favored zone to start 2018 and helps give you the confidence to stay in the strong equity markets. The U.S. Equity market measured by the S&P 500 Index recorded its best month since March of 2016 which started the year so far in January up 5.62% finishing at 2,823.81. The Nasdaq Composite Index had an even better January to start 2018 finishing up 7.36%.U.S. economic data have been strong lately with Moody's Analytics saying that private companies added 234,000 jobs in January which was higher than the expected a gain of 185,000. Meanwhile, weekly jobless claims remain near their lowest levels in about 40 years.
Resistance levels above for the SPX.I could come into play at the psychological level around 3000 and above this resistance can be found at 3260 if the strength continues. The S&P 500 Point and Figure chart has been in a column of X’s since March of 2016 so for almost 2 years, it hasn’t had a pull-back on a 2% scale. Looking at the history of the chart, this is bound to change this year, but a pull-back isn’t out of the ordinary and can be considered normal movement down to the support level at 2622.6. Below this level and depending on what the SIA Asset Class Rankings show at the time, you will want to see if the second Support level at 2520 holds. This extended bull run in equities is not going to last forever as it is currently on an 8 and a half bull run, but you can rely on the power of relative strength to help guide you through future asset class transitions when they do come.
iShares MSCI China ETF (MCHI)
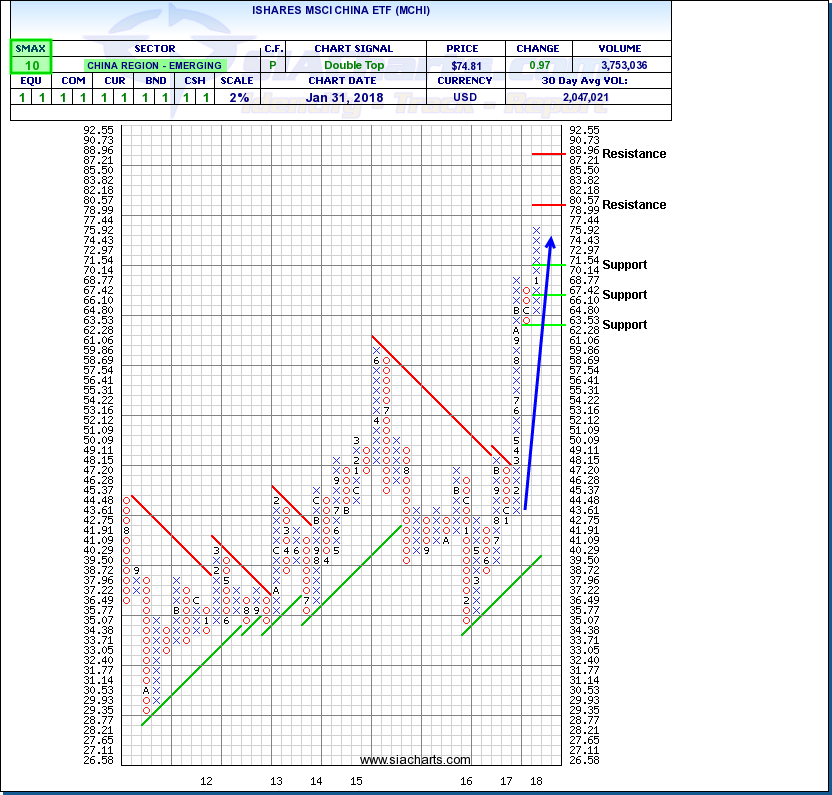
Although the U.S. Equity markets have had a terrific start to 2018, International Equity still remains the top asset class in the SIA Asset Class rankings for a reason as countries like China have more than doubled the U.S.’s performance in the first month. The iShares MSCI China ETF (MCHI) seeks to track the investment results of an index composed of Chinese equities that are available to international investors. MCHI is up 12.43% ytd so far and this after finishing 2017 up almost 55%. If we take a closer look at the key holdings in MCHI, it has a heavy weighting (40%) in Tencant Holdings and Alibaba, two of the biggest companies in the world. The sectors of Information Technology and Financials make up a majority of the top holdings that have done very well outperforming most other sectors in China contributing to this outperformance.
Looking at the chart of the ETF shows resistance levels above at $80.57 and $88.96 with support found around $70 and at $66.10. MCHI is showing near-term strength with an SMAX score of 10 out of 10 as well. The main takeaway isn’t so much about the specific ETF, but that SIACharts can help you gain exposure to International markets when they are ranked high by saving you valuable time researching each country or region. The SIA International Equity Universe ETF Report has this and other Chinese ETFs ranked at the top and they have been for some time.
SIACharts.com specifically represents that it does not give investment advice or advocate the purchase or sale of any security or investment. None of the information contained in this website or document constitutes an offer to sell or the solicitation of an offer to buy any security or other investment or an offer to provide investment services of any kind. Neither SIACharts.com (FundCharts Inc.) nor its third party content providers shall be liable for any errors, inaccuracies or delays in content, or for any actions taken in reliance thereon.
For a more in-depth analysis on the relative strength of the equity markets, bonds, commodities, currencies, etc. or for more information on SIACharts.com, you can contact our sales and customer support at 1-877-668-1332 or at siateam@siacharts.com.