by Blaine Rollins,CFA, 361 Capital
Corporate America continues to exceed expectations as the bulk of the earnings season winds down. Both sales and earnings beats are above their historical averages as the global economy continues to pick up helping top-line beats, while also creating incremental margins to assist the in bottom-line beats. Before the earnings season started, Q3 expectations were reduced rather significantly on worries over U.S. growth and falling energy prices. But since then, the realized U.S. data points in October have rebounded and the hurricane storm impact was evident but absorbed. Looking forward, the Technology and Materials sectors look well positioned to benefit from GDP growth, while the Energy sector could be the giant upside surprise for Q4 should commodity prices continue to bounce. (And don’t forget to factor in this weekend’s episode of the Saudi Game of Thrones which could push energy even further.)
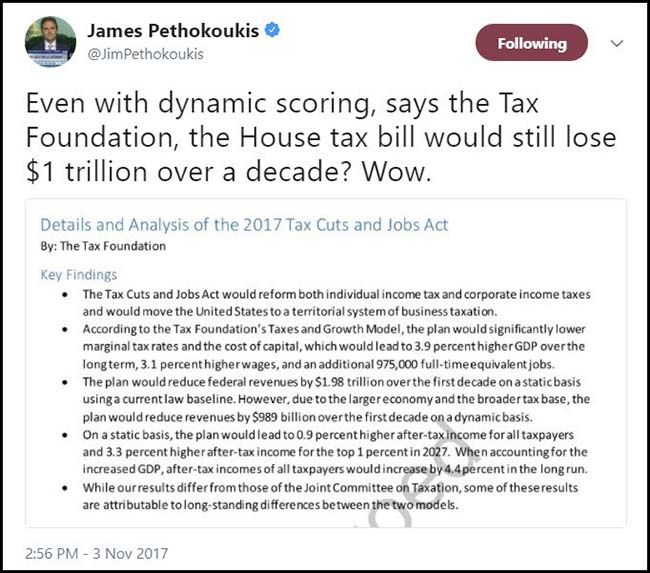
While equity investors focused on corporate earnings, many others fretted over the House’s tax reform package. I still see major tax reform as highly unlikely so didn’t spend too many hours reading up on the details. There is no bigger fan of tax simplification than I, but if Congress is going to tackle one of the biggest items in politics, it will need a very organized, well thought out plan with significant leadership backing. What I saw looked more like a 2nd grader’s science fair project that was assembled by sleep deprived-parents at 2 am. And cutting taxes on pass-through entities and eliminating AMT? I can only guess whose idea that was. But even with dynamic scoring, the current House plan will add $1 trillion to our U.S. debt levels. So, I can’t believe that this is anything that fiscal conservative members of Congress will vote for.
The good news is that the markets absolutely do not care. The jobs report was good. Three percent GDP looks to be on track. Short-term interest rates are agreeing and moving higher. There is a new head at the Fed and the Bond market is calm about the change. And corporate merger and acquisition departments are busy looking past Washington and moving forward with strategic deals. (Broadcom/Qualcomm, Marvell/Cavium, CVS/Aetna and now Disney/21st Century Fox.) So, ignore the clouds and fog and keep your eye on that landing ramp and all will be fine.
To receive this weekly briefing directly to your inbox, subscribe now.
October ended strong and November has grabbed the baton…
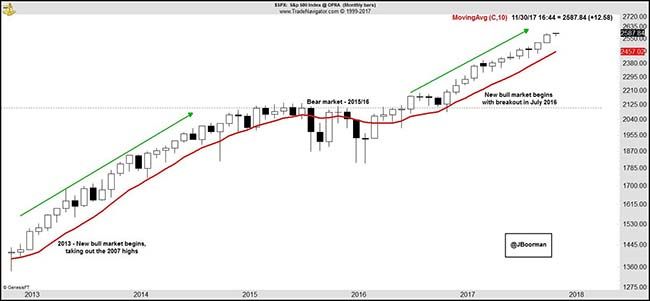
@JBoorman: $SPX starts November the same as the previous six months, with a higher high and higher low.
When ‘Sell in May and Go Away’ doesn’t work, get long…
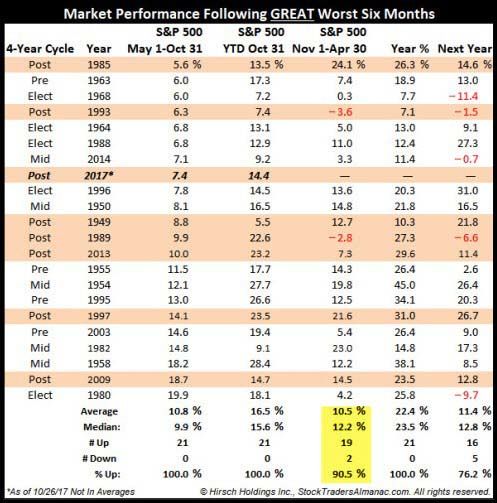
Throughout the year, we have been highlighting a now considerable list of positive studies suggesting that US equities will likely finish the year higher. The longer-term outlook for US equities remains positive. SPX rose more than 8% during May-October. This period is often considered the “weakest 6 months of the year”; when SPX has done well during this period, the next 6 months have also been strong, with SPX gaining a median of 12% and closing the period with a gain 91% of the time (next two charts from Stock Almanac).
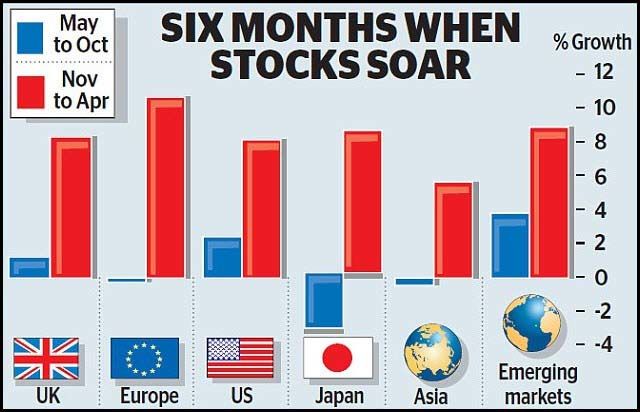
And year-end seasonality is not just a U.S. thing…
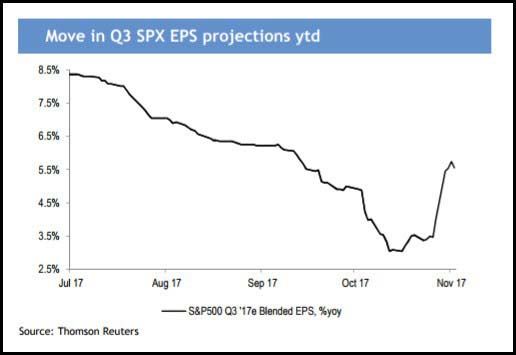
Focusing on earnings, look at the recovery in Q3 earnings as companies have crushed their quarters the last three weeks…
(JP Morgan)
Very interesting to see the surprises in the Energy sector…
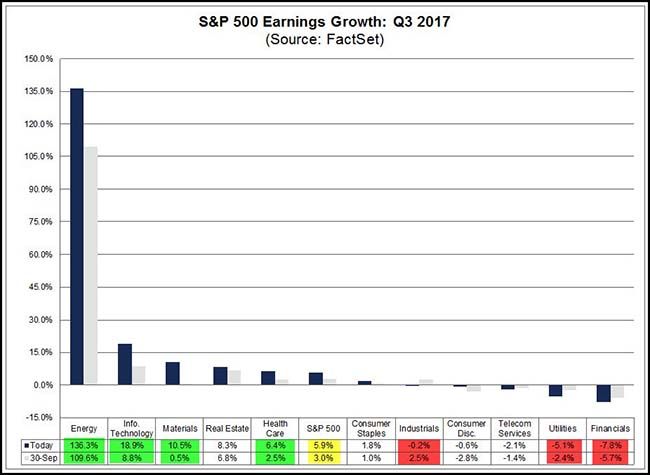
To date, 81% of the companies in the S&P 500 have reported actual results for Q3 2017. In terms of earnings, more companies (74%) are reporting actual EPS above estimates compared to the five-year average. In aggregate, companies are reporting earnings that are 4.8% above the estimates, which is also above the five-year average. In terms of sales, more companies (66%) are reporting actual sales above estimates compared to the five-year average. In aggregate, companies are reporting sales that are 1.2% above estimates, which is also above the five-year average.
The blended (combines actual results for companies that have reported and estimated results for companies that have yet to report) earnings growth rate for the third quarter is 5.9% today, which is higher than the earnings growth rate of 4.4% last week. Upside earnings surprises reported by companies in multiple sectors (led by the Information Technology sector) were responsible for the increase in the earnings growth rate for the index during the past week. Overall, six sectors are reporting earnings growth, led by the Energy, Information Technology, and Materials sectors. Five sectors are reporting a year-over-year decline in earnings, led by the Financials sector.
(Factset)
And some great conference call data points that give great insight…
“From an end market perspective, virtually all improved during the quarter. Aerospace, fabricated metals and oil and gas continued to show strength while other end markets like heavy truck and agriculture which had bottomed out several quarters earlier are improving. In general, as customer sentiment remains positive and the industries hold the current levels, we should continue to see solid sales trends.” — MSC Industrial (Distributor)
“While competitive intensity remains high, several suppliers began taking prices up or signaling that price increases are likely in the coming months…what we are telegraphing here is a big bit firmer and more defined activity than what we have seen in past years at this point in time.” — MSC Industrial (Distributor)
“This is a broad-based growth…We’re really growing across the globe…better than we’ve seen in over five years. Really, really coming out of the recession was the only other time we saw this kind of growth number.” — UPS (Logistics)
“The data that we see has the ocean utilization at over 97%. So you have a high, high, demand environment now with capacity really becoming tight…then you get up in the air, this is the fourth consecutive quarter where you really had demand outpacing capacity.” — UPS (Logistics)
“In fact, Brent is already over $60. So as I like to say, I’m going to declare victory and retreat. In terms of what has to happen now for there to be increased investment, I think it’s going to happen…I think what’s going to happen – what’s happened is that there has been an enormous, enormous underinvestment in productive capacity worldwide. It’s breathtaking how big that underinvestment has been.” — Loews (Conglomerate)
Texas Roadhouse is seeing much more labor inflation than it predicted…
The Louisville-based casual-dining chain said that its same-store sales increased 4.5 percent at company locations in the period ended Sept. 26. They increased 4.7 percent at franchise locations…
But margins as a percent of sales fell 31 basis points to 17.8 percent, the company said, as higher wages offset lower food costs.
Revenue at the company increased 12.2 percent to $540.5 million, from $481.6 million a year ago. Net income increased 20.8 percent to $31 million or 43 cents per share, from $25.7 million, or 36 cents…
The company increased its outlook for labor inflation, to between 7 percent and 8 percent, after previously saying labor would rise in the mid-single digits.
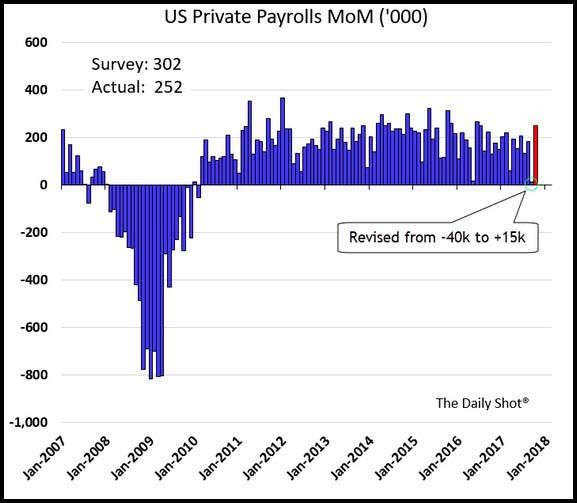
After a hurricane affected jobs number last month, the economy hopped back on track on Friday…
(Daily Shot/WSJ)
Goldman sees further job creation ahead…
Based on the 261k rebound in nonfarm payrolls in October and the 90k cumulative upward revision to prior months, the US labor market is still making steady headway. After cutting through the hurricane-related noise, we think trend payroll growth remains in a 150-200k range, well above the roughly 100k breakeven rate that is needed to keep the unemployment rate stable over time. And the robust activity data more generally—real GDP growth in Q2/Q3 probably averaged 3.3% after revisions and our current activity indicator (CAI) is now at 4.0% for October— suggest that job creation should remain firm in the near term.
(Goldman Sachs)
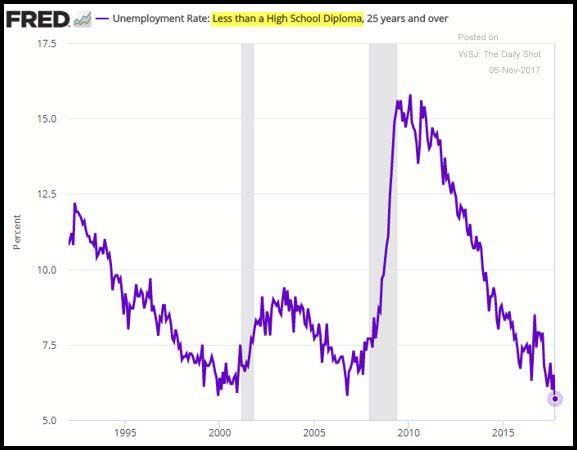
Very encouraging to see is that even those without high school degrees are seeing the best job market in decades…
(Daily Shot/WSJ)
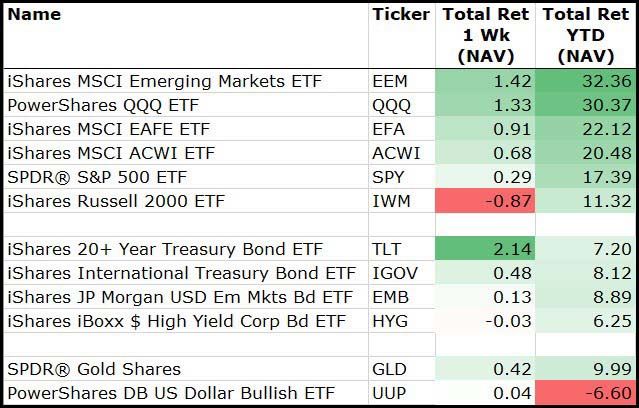
For the week, Bonds, Technology & International Equities led…
Small Caps took a rest on concerns over the House’s tax proposal.
(11/3/17)
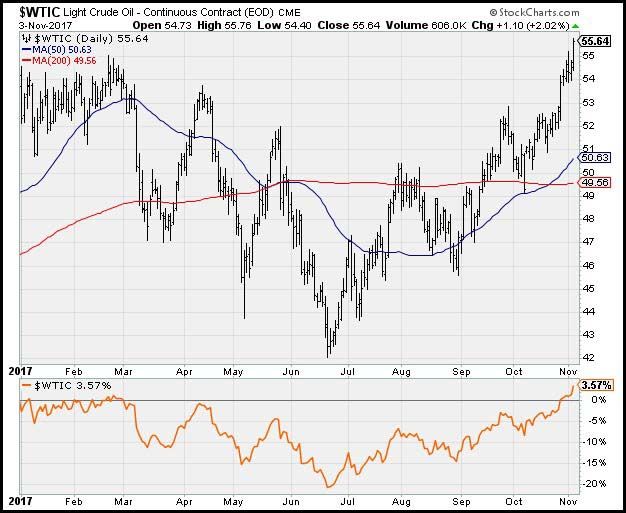
Also important to note is the continued big move in Oil…
From -20% at midyear to now positive YTD returns.
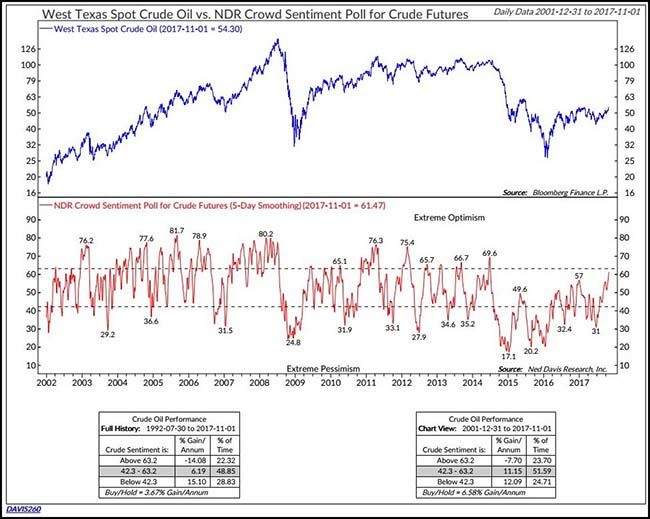
Oil has been a forgotten asset since that Thanksgiving in 2014…
@tonywelch17: Oil sentiment at its highest level since 2014. Normally contrarian but this may be just what we need to get folks buying into the equities.
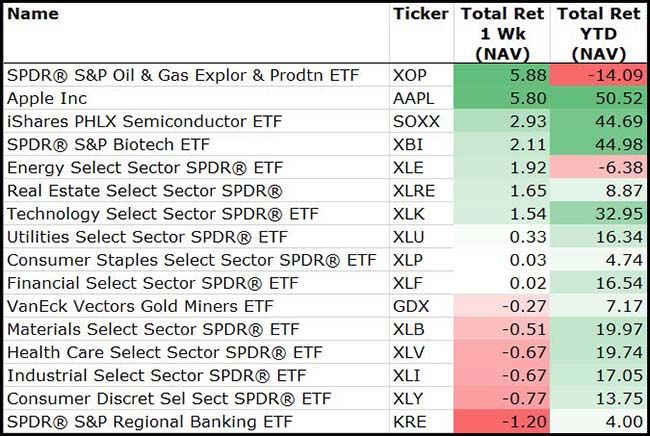
For the week, Energy, Technology and Semis led…
(11/3/17)
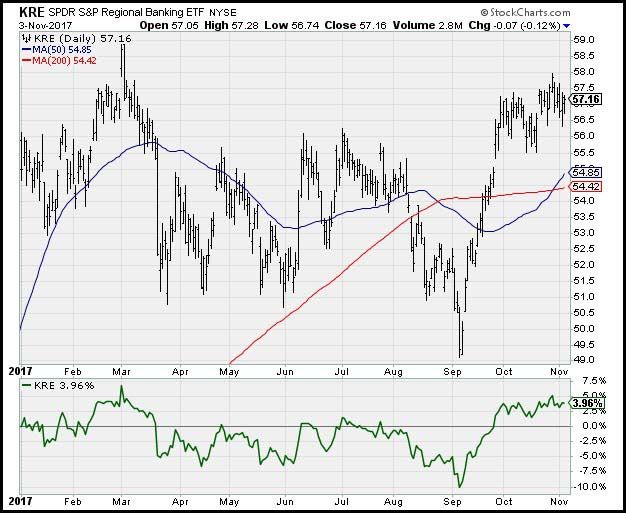
Banks had a tough week as Bonds ripped higher…
But not just longer bond yields falling, but the curve is really flattening out here…
@charliebilello: US Yield Curve ends the week at its flattest level of the expansion: 71 bps spread b/t 10-yr and 2-yr yields. $TNX
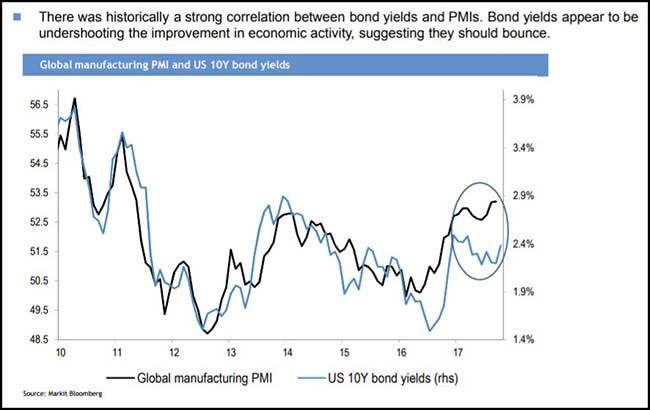
Bond yields should be moving higher with the economic activity but too many other influences right now… like the new Fed Chair, Washington politics and of course relative bond values…
(JP Morgan)
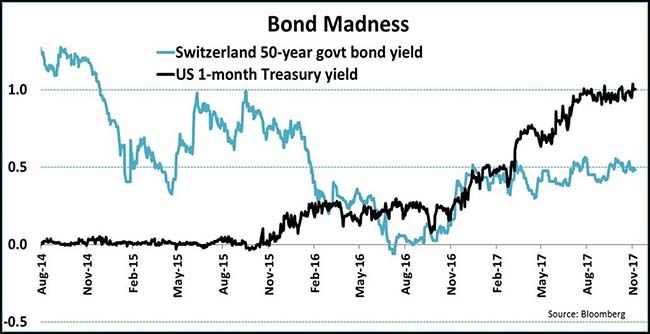
…like it is tough to argue with grabbing 1% yielding 1 month T-bills over 0.5% yielding 50 year Swiss Govt bonds!
(@jsblokland)
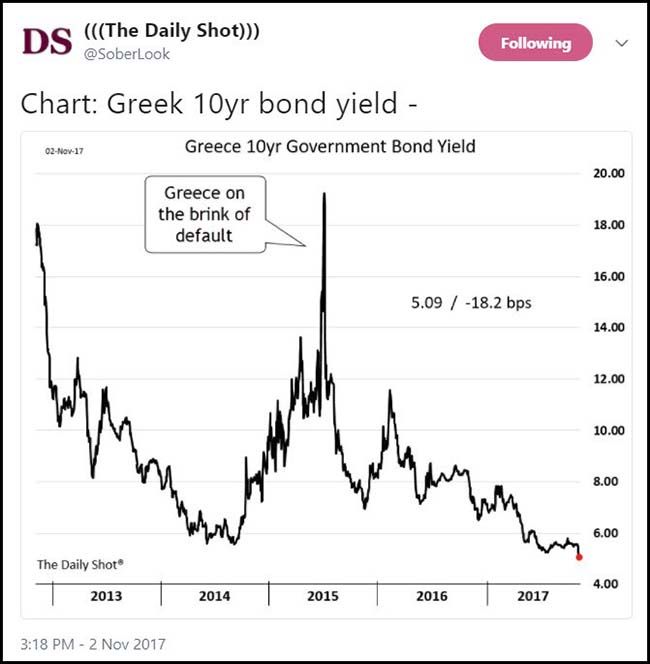
And who can forget where Greece traded only two years ago!
They are going to need even more dynamic scoring…
I am a fan of using dynamic models to forecast change, but even with the planned tax proposals, the House is looking to add $1 trillion to the debt levels over the next 10 years. They should keep working on tax changes, but when times are good like they are today, the House should be looking to repay debt as quickly as possible before inflations lifts its ugly head and rising interest costs drown us with even more debt. A basic math and simple economics class should be a requirement for all future residents of D.C.
And in other tragically bad economic decisions… Brexit.
@Peston: The Bank of England blames Brexit, for above-target inflation, below-trend growth and the necessity to raise interest rates
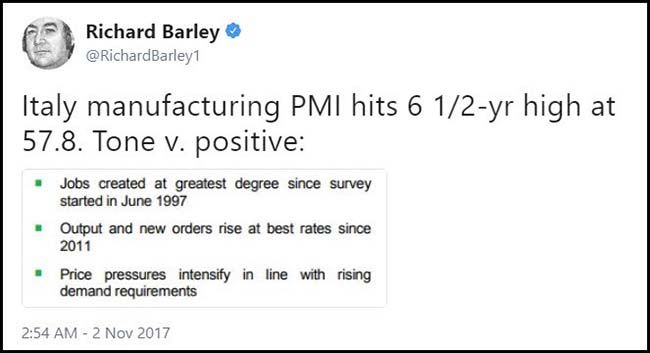
Of course little reason to invest in the U.K. when you can own Italy…
Only seven weeks until Christmas…
And if you really want to see how the U.S. consumer feels, ask them what they are planning on spending for the holidays.
Gallup’s initial measure of consumers’ 2017 Christmas shopping plans suggests retailers could see the best holiday sales in years. The chief indicator is a sharp increase in the amount Americans say they plan to spend on Christmas gifts — now $906, up from $785 in October 2016. That represents one of the biggest year-over-year increases in Gallup’s trend, pushing the spending projection to its highest level in a decade.
(Gallup)
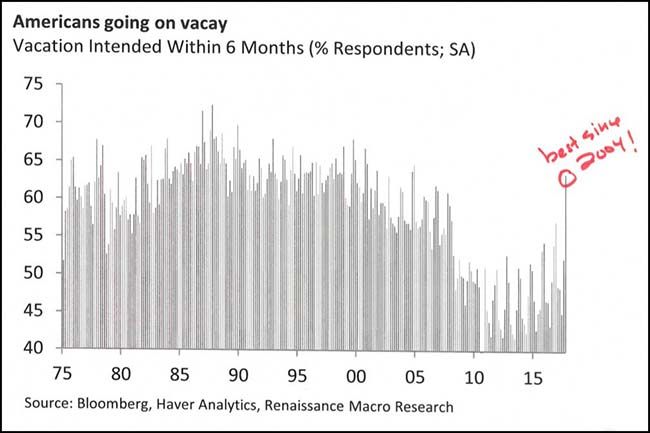
Better yet, ask them if they are going to take a vacation!
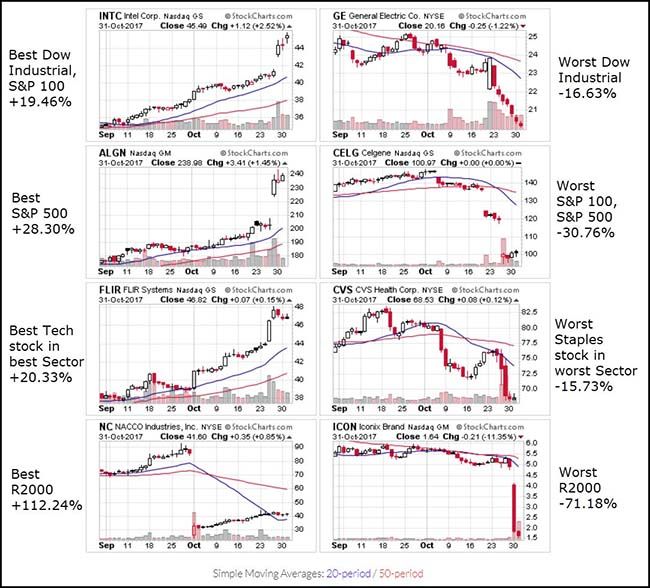
As October finished last week, I grabbed the top and bottom performers for the month…
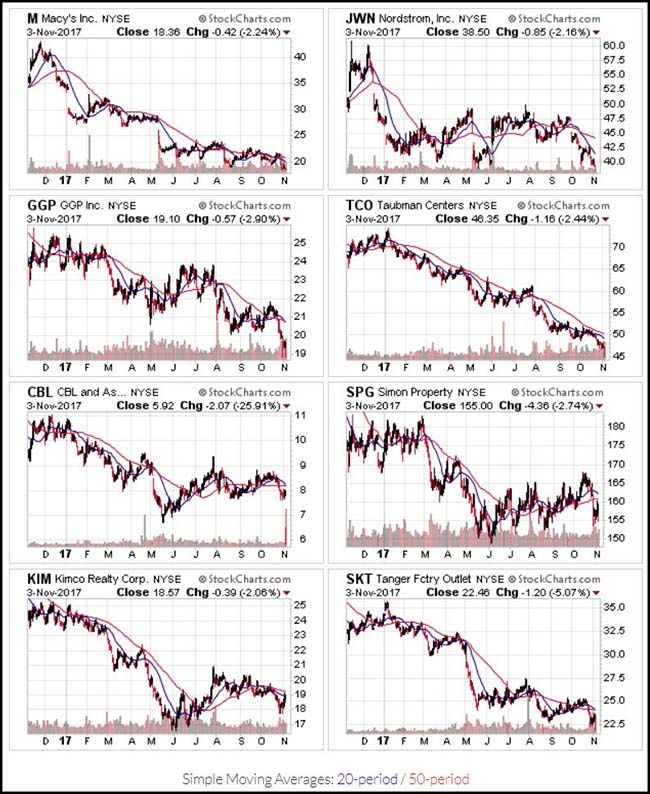
Lumps of coal…
Christmas might be approaching and consumers are ready to spend, but the market doesn’t see any holiday cheer at the top Mall anchors, nor at the REITs that own all that square footage. These are some ugly one year charts.
A good read for all the students and parents currently joining me in running through the college application gauntlet…
Whatever happens, age-old questions about fairness in admissions will surely endure. For one thing, the nation can’t come to terms with a tricky five-letter word: merit. Michael Young, a British sociologist, coined the pejorative term “meritocracy” over a half-century ago to describe a future in which standardized intelligence tests would crown a new elite. Yet as Rebecca Zwick explains in her new book “Who Gets In?” the meaning has shifted. The word “merit,” she writes, has come to mean “academic excellence, narrowly defined” as grades and test scores.
But that’s just one way to think of an applicant’s worthiness. Dr. Zwick, professor emeritus at the University of California at Santa Barbara, has long been a researcher at the Educational Testing Service, which develops and administers the SAT. She disputes the notion that testing prowess — or any other attribute, for that matter — entitles a student to a spot at his chosen college. “There is, in fact, no absolute definition of merit,” she writes.
That brings us to you, the anxious applicant, the frazzled parent, the confused citizen, all wondering what colleges want. It’s worth taking a deep breath and noting that only 13 percent of four-year colleges accept fewer than half of their applicants. That said, colleges where seats are scarce stir up the nation’s emotions. Each year, the world-famous institutions reject thousands and thousands of students who could thrive there.
Yes, rejection stings. But say these words aloud: The admissions process isn’t fair. Like it or not, colleges aren’t looking to reel in the greatest number of straight-A students who’ve taken seven or more Advanced Placement courses. A rejection isn’t really about you; it’s about a maddening mishmash of competing objectives.
Finally, for the rocket surgeon snowboarder in your life…
The U.S. 2018 Winter Olympic gear has been dropping into the retail channel. Burton designed its snowboard line with a big hat-tip to NASA. This gear will be the first to sellout so place your orders now.
(Burton)


