by Ryan Detrick, LPL Research
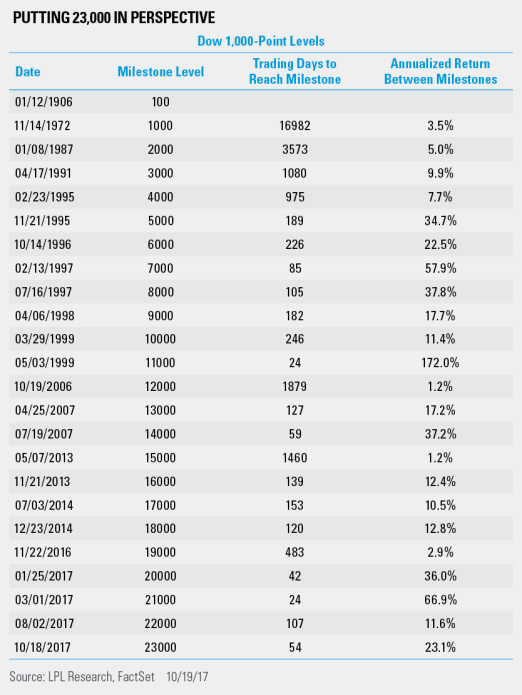
The Dow Jones Industrial Average (Dow) closed above 23,000 for the first time ever on Wednesday, marking the fourth 1,000-point milestone cleared so far in 2017.
To put that into perspective, no other year has cleared more than two 1,000-point intervals. Of course, the percentage increase needed to reach each subsequent interval gets smaller; still, this is yet another way of showing how rare and strong 2017 has been.
As the chart below shows, it took only 54 trading days for the Dow to go from 22,000 to 23,000—one of the quickest 1,000-point jumps ever.
Here’s a look at some of the Dow’s major big milestone levels:
- The Dow first closed above 100 in January 1906, but it traded consistently below this level until 1924 amid the 1920’s bull market. After the stock market crash of 1929 and the Great Depression that followed, the Dow traded beneath 100 until May 26, 1942—some 36 years from the first time it closed above this level.
- The Dow first reached 1,000 on an intraday basis on January 18, 1966. However, it didn’t officially close above this level until November 14, 1972—nearly seven years later. Shortly after that, it moved back below 1,000 and didn’t break back above it for another 10 years.
- The Dow first closed above 10,000 in early 1999, but the bursting of the dot-com bubble a year later pushed it back below that mark, which it failed to recapture until the summer of 2010, nearly 11 years later.
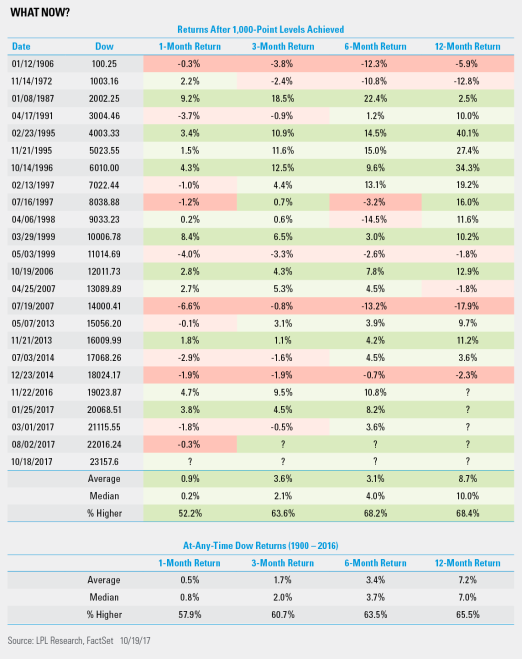
So what tends to happen after big round milestones? Do these big 1,000 levels slow down rallies? History suggests that there could be a pause, but the subsequent returns a year later have been above average, which makes sense as above-average returns are most often seen during bull markets.
Per Ryan Detrick, Senior Market Strategist, “Besides being a big number, 23,000 really isn’t any more special than 22,999. Still, we sometimes like to use these milestones as a chance to reflect and take a closer look at how investors’ portfolios are positioned. In the end, it is important to remember that fundamentals, technicals and valuations have always and will continue to drive equity gains over the long term – not big round numbers.”
*****
IMPORTANT DISCLOSURES
The opinions voiced in this material are for general information only and are not intended to provide or be construed as providing specific investment advice or recommendations for any individual security.
Past performance is no guarantee of future results.
The economic forecasts set forth in the presentation may not develop as predicted.
Investing in stock includes numerous specific risks including: the fluctuation of dividend, loss of principal and potential illiquidity of the investment in a falling market.
Dow Jones Industrial Average is the most widely used indicator of the overall condition of the stock market, a price-weighted average of 30 actively traded blue chip stocks, primarily industrials. The 30 stocks are chosen by the editors of the Wall Street Journal. The Dow is computed using a price-weighted indexing system, rather than the more common market cap-weighted indexing system.
This research material has been prepared by LPL Financial LLC.
To the extent you are receiving investment advice from a separately registered independent investment advisor, please note that LPL Financial LLC is not an affiliate of and makes no representation with respect to such entity.
Not FDIC/NCUA Insured | Not Bank/Credit Union Guaranteed | May Lose Value | Not Guaranteed by any Government Agency | Not a Bank/Credit Union Deposit
Securities and Advisory services offered through LPL Financial LLC, a Registered Investment Advisor
Member FINRA/SIPC
Tracking #1-657742 (Exp. 10/18)
Copyright © LPL Research


