
by Lacy Hunt and Van Hoisington, Hoisington Investment Management
The worst economic recovery of the post-war period will continue to be restrained by a consumer sector burdened by paltry income growth, a low and falling saving rate, and an increasingly restrictive Federal Reserve policy. Additionally, with the extremely high level of U.S. government debt and deteriorating fiscal situation, the economy is unlikely to benefit from any debt-financed tax changes. Finally, from a longer-term perspective, the recent natural disasters are an additional constraint on economic growth.
Consumer
Nominal GDP has expanded by $712 billion over the past four quarters. Consumer spending, which was up $552 billion, represented 77% of this growth. For the past five years, consumers have accounted for about 68% of GDP, which is nearly identical to the average over the past 20 years. Clearly, consumer spending is a crucial component of maintaining growth in GDP. Consumer spending is funded either by income growth, more debt or some other reduction in saving. Recent trends in each of these categories, as outlined below, do not bode well for this critical sector of the U.S. economy.
First, in the past five years real disposable income growth (DPI) has averaged a disappointing 2%. Real DPI has been flat over the last three months and has risen only 1.2% over the past year. On a per capita basis over the past year, the growth rate is one-half of 1%, which is one-quarter of the historic growth rate. In nominal dollar terms, DPI has risen a paltry 2.7% over the past year. Consumer spending, in contrast, has risen much faster over the past year, growing by 3.9%.
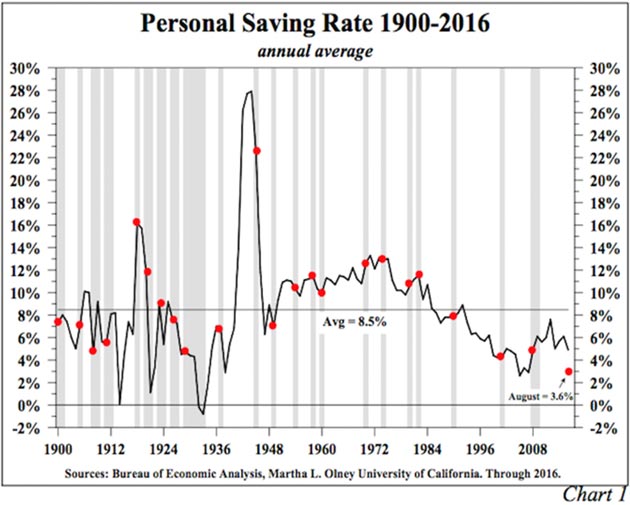
Second, in an effort to maintain their standard of living in the face of slowing income growth, consumers stepped up their borrowing and significantly reduced their savings. In national income accounting, personal saving is calculated by subtracting personal outlays, including interest and transfer payments, from disposable personal income. As an example, in the past month personal income was $14.4 trillion (SAAR), with personal outlays of $13.9 trillion, resulting in total personal saving of $523 billion, or 3.6% of income. That is about three-fifths less than the 8.5% saving rate level that has existed since 1900 (Chart 1). As recently as five years ago the saving rate was 7.6%.
An increase in borrowing was the major factor behind the recent slide in the saving rate.
Consumer credit over the past year has risen by $208 billion, or 5.9%. Interestingly, without the drawdown in the saving rate, real consumer spending over the past two years would have been reduced by more than half. Considering the slow and declining rate of growth in income as well as the low saving rate, it appears that the current spending level cannot be sustained.
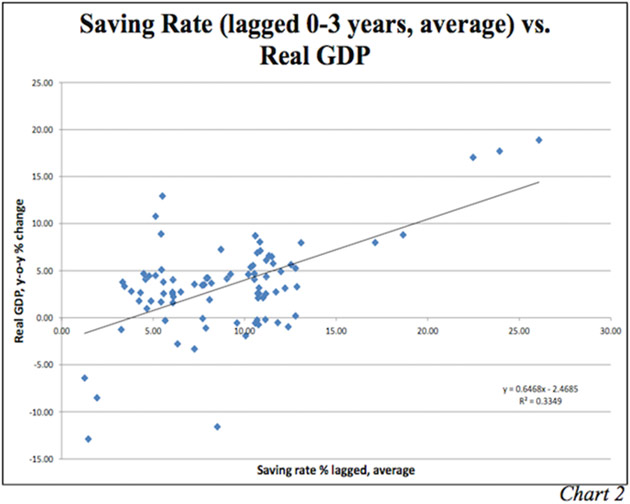
Historically there has been an important relationship between the saving rate and economic growth. A high initial saving rate has been associated with subsequently stronger economic growth, while a low saving rate produces a lower growth pattern. This observation can be confirmed by observing year-over-year growth in GDP plotted against the average of the current saving rate, with lags in the rate of one, two and three years (Chart 2). Since 1930 the regression coefficient indicates that a 1% drop in the personal saving rate in the current and prior three years will lower the real GDP growth rate by a substantial 0.65%. Considering that the present 3.6% saving rate is lower than all of the initial starting points of economic contractions since 1900, the outlook for ebullient growth is problematic particularly in the context of slow and diminishing income growth.
Fed Tightening
The prospect for stronger economic growth in the economy is clouded further by restrictive actions previously taken by the Federal Reserve (the effects of which are still being felt) along with the promise of further rate hikes, and by the coming reduction in the Fed balance sheet, or quantitative tightening (QT).
The massive balance sheet expansion recorded during the three separate quantitative easing (QE) episodes did not produce significant growth in the money supply (M2) or in nominal GDP, despite predictions to the contrary. Indeed the expansion has been the slowest in the post-war period. Thus it is perceived, and the Fed has assured the public, that a modest reduction in the balance sheet will have only a benign impact on the economy. This presumed symmetry in monetary actions may exist in certain economic circumstances, but in a heavily indebted society Fed actions are highly asymmetric. The current evidence of this is that the mere four small 25 basis point increases in the federal funds rate over the past year and a half, and resultant lowering of excess reserves, have produced a noticeable slowing in the growth of M2. Additionally, credit aggregate growth has slumped. The application of widely accepted monetary theory and history implies that QT will further reduce excess reserves and the monetary base, and this will have a profound slowing effect on money and credit. Therefore, the growth of nominal GDP and inflation will be headed lower.
Theoretical Model
The math and the relationship of the monetary base to other monetary factors have been well established and tested. Therefore, these relationships can be used to estimate the impact of QT as follows:
- M2 equals the monetary base (MB) times the money multiplier (m or little m).
- Little m is greater than one whenever the banks operate under a fractional reserve requirement system.
- GDP equals M2 times the velocity of money (V), which is the same as saying that M2 and V determine aggregate demand (AD).
The U.S. operates with a fractional reserve system, thus the money multiplier (m) is greater than one, and a dollar decrease in the base will lower M2 by more than a dollar (Chart 3). Currently, little m is 3.6, an amount determined by dividing M2 of $13.7 trillion thus far in 2017 by $3.8 trillion for the monetary base.
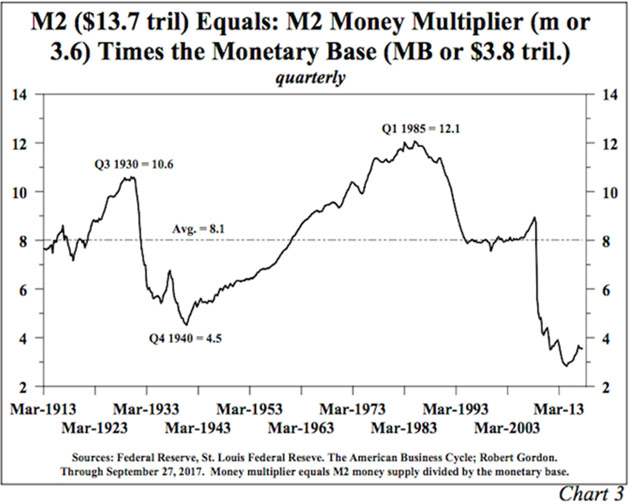
Little m is primarily determined by swings in currency held by the public, the Treasury’s deposits at the Fed, excess reserves of the depository institutions and the ratio of demand deposits to time and savings deposits. Prior to the announcement of the first round of QE the level of m was generally consistent with the 8.1% average that prevailed since the start of the Fed in 1913. Presently, however, m is greatly depressed (Chart 3).
However, assuming m holds at this depressed level of 3.6, QT as announced by the Fed ($30 billion in the fourth quarter) is tantamount to a $105 billion decrease in M2. M2 increased by 5.1% in the latest 12 months, or an average monthly increase in M2 of $55 billion. The math means that M2’s annual rate of growth will recede to 4.2% by the end of 2017. This is a sharp slowdown from the near 7% growth in 2016, owing to the previous interest rate increases and resultant decline in bank reserves. The effect on bank loans and other short-term credit aggregates would be similar, reducing the 12-month increase from 3.8% to about 2.5% by the end of the year.
If the Fed were to continue reducing the base for the first nine months of 2018, the annual rate of growth in M2 would fall to negative 2.8%, applying the same calculation. Using the Fisher equation of exchange, where M2 times its turnover (velocity) equals nominal GDP (M2*V=GDP), it is possible to see the incredible negative impact if M2 declines by that much, assuming that velocity remains stable at 1.43, its lowest level since 1949. Incidentally, velocity has been declining at a 2.5% rate over the past five years. Given the math outlined above, the probabilities are high that QT will not be sustained for the duration of 2018, or that substantial offsetting purchases of securities (repo or outright) will be necessary to offset the existing maturities.
Tax cuts
Negative existing federal fiscal conditions strongly suggest that any benefit of the proposed debt-financed tax cut is likely to be very muted, if it is positive at all. The U.S. budget deficit, according to the non-partisan Congressional Budget Office (CBO), surged to an estimated $693 billion in the fiscal year that ended September 2017, up from $585 billion and $438 billion, respectively, in fiscal 2016 and 2015. Deterioration in the budget deficit of this magnitude is unprecedented in a late-stage business cycle expansion. In the late-stage expansions of both the 1990s and early 2000s, the deficit was reduced significantly. Indeed, late in the 1990s’ expansion, budget surpluses were registered.
Unfortunately, the deficit doesn’t capture an accurate picture of the federal financial situation. An increasing number of items have been taken off the expenditure accounts and re-categorized as “investments.” This accounting gimmickry has artificially reduced deficits for the past three fiscal years relative to the actual amount of debt that was incurred. For example, the increase in federal debt for the three years ending September 30, 2017 totaled $3.2 trillion, or almost twice the $1.7 trillion cumulative deficit for these three years.
It appears that gross U.S. government debt will very shortly reach a new record of 110% of GDP. At the end of calendar 2016, this ratio was 106.1% of GDP. Econometric studies indicate that such high levels of U.S. debt reduce the trend rate of growth in economic activity and quite possibly at a non-linear pace. One major study found that when this debt ratio exceeds 90% for five consecutive years, the economy loses one-third of its trend rate of growth. The U.S. government debt ratio has exceeded 100% for each of the past six years.
When the 1981 Reagan and 2001 Bush tax cuts were implemented, U.S. government debt was 32% and 55%, respectively, of GDP. Further, the Reagan and Bush tax cuts were supported by a sharply falling federal funds rate, much stronger monetary growth and significantly higher level of money velocity. In the first three years of the 1981 and 2001 tax cuts the federal funds rate fell by 960 and 500 basis points, respectively. Since the federal funds rate is currently 1.00% to 1.25% and rising, such previous rate reductions are in sharp contrast to today’s monetary environment. A host of other critical initial conditions - including favorable demographics, debt and productivity - were also much more supportive of economic growth then than now. Therefore, the combination of existing large deficits and record debt levels with a restrictive Federal Reserve will mean any tax cuts will have only a muted impact at best on economic growth.
Natural Disasters
The recent natural disasters have been viewed as providing a potential boost to economic activity. This is an incorrect assessment. If a natural disaster destroys viable homes, businesses and infrastructure, then more of current household and corporate saving (income less spending) will be diverted from normal spending to disaster spending. Hence, disaster recovery spending will benefit some while hurting others. For example, funds would likely be diverted from new business ventures, research and development or household formation and various other consumer/ government goods and services.
Savings, which is defined as accumulated saving or wealth, must be liquidated in order to restore functionality. A reduction in savings will lead to an impairment of balance sheet wealth. In spite of a transitory boost to GDP after the end of the disruptions, two measures - income allocation and reduction of savings - indicate society is worse off, meaning over time that growth and prosperity will be reduced.
The unseen or unintended consequence of a natural disaster is to weaken an economy over the course of time. U.S. government action to cover the losses of a disaster leads to larger budget deficits and additional debt financing, but the increased expenditure financed in this manner results in a decline in private expenditures that is greater than the increase in debt financing. The action may be socially responsible and politically necessary, but at the end of the day the economy’s growth trend will be reduced, regardless of the possible short-term effect of additional deficit financing. For state and local governments that typically lack the option of additional deficit spending, the trade offs are serious and direct. If a state or local government raises taxes to cover disaster relief, this may cause firms to shift operations elsewhere in the state or to some other state entirely. In short, the opportunity cost of natural disasters is far larger than any immediate benefit that accrues from a short-term rebuilding effect on GDP, resulting in another drag on future growth.
Treasury Bonds
With monetary restraint continuing to weigh on economic growth for the remainder of 2017 and 2018, inflation, which receded sharply this year (PCE is up 1.2% year-to-date and 1.4% year-over-year), will continue on a downward path. Coupled with extreme over-indebtedness, these factors are the dominant factors causing both cyclical and secular growth to weaken. Additionally, these negative impulses are presently being reinforced by the problems of poor demographics and productivity. Population growth in 2016 was the slowest since 1936-37 - roughly half of the post-war average - and the fertility rate in 2016 was the lowest on record. These trends have contributed to the declining growth of household formation, which is now less than one-half the rate of increase that has been experienced since 1960. Productivity in the eight years of this expansion was the lowest for any eight-year period since the end of World War II.
These existing circumstances indicate that a Fed policy of QT and an indicated December hike in the federal funds rate will put upward pressure on the short-term interest rates. At the same time, lower inflation and the resultant decline in inflationary expectations will place downward pressure on long Treasury bond yields, thus causing the yield to curve to flatten. Continuation of QT deep into 2018 would probably cause the yield curve to invert. Short-term interest rates are determined by the intersection of the demand and supply of credit that the Fed largely controls by shifting the monetary base and interest rates. Changes in long-term Treasury bond yields are primarily determined by inflationary expectations. Inflationary expectations will ratchet downward in this environment, pushing the long Treasury bond yields lower.
Van R. Hoisington
Lacy H. Hunt, Ph.D.
Copyright © Hoisington Investment Management