For this week’s edition of the Equity Leaders Weekly, we are going to re-examine the Crude Oil Continuous Contract (CL.F) to see if the short-term strength has changed the long-term outlook or if it has broken out of its main trading range. We will also take a close look at the Canadian Equity Asset Class through the S&P/TSX Composite Index analysis as this main index has moved into positive territory for the first time this year in a while up +2.1% now YTD, but still trails the U.S. (up +12% YTD) and International (up over 20%) main indices by a wide margin.
Crude Oil Continuous Contract (CL.F)
U.S. crude stocks fell last week as refineries hiked output because they restarted following Hurricane Harvey, while gasoline stocks increased and distillate inventories fell, the Energy Information Administration said on Wednesday. For the week ending September 22nd, the American Petroleum Institute reported U.S. crude stockpiles fell by 761k barrels helping lead to some higher oil prices in the short term. But this really came as no surprise in light of the recent release of oil stockpiles to help with the disruption of production and refinement in light of Hurricane Harvey and Irma over the last month in the Gulf of Mexico. If looking at the backwardation of futures spot prices, the rise in oil prices recently has a speculative nature and is not based on a long-term change in the balance of supply and demand based on market prices.
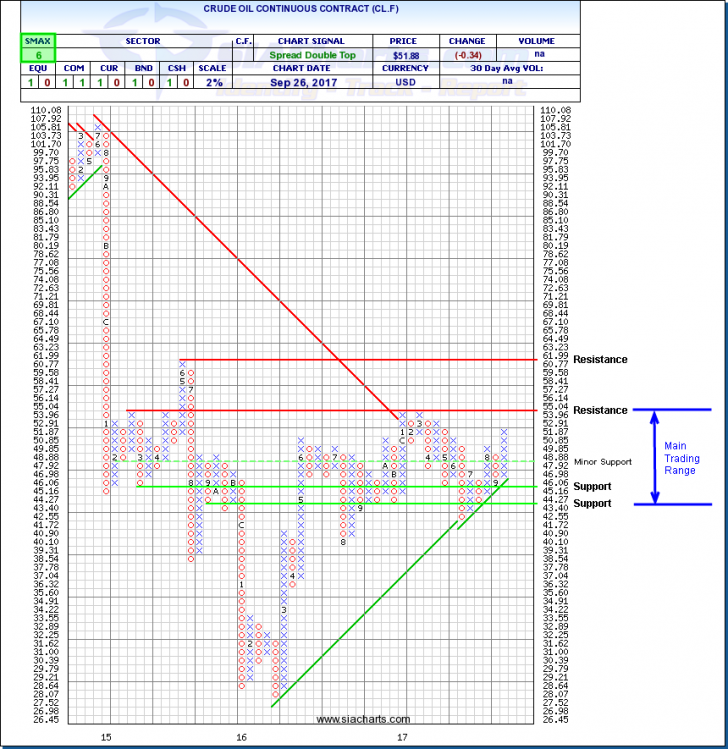
Looking at the Crude Oil Continuous Contract (CL.F) Point and Figure chart at 2% gives us a great longer-term outlook on the recent short-term movement as this shouldn’t be a surprise to see Oil prices move up and down within the main trading range Oil has done mostly over the last year between $43 and $55 USD. Support is found at $43.40 and at $45.16 on the low end and resistance can be found at $55.04 to the high end with further resistance above this at $62 from the high in June of 2015 should it break through. Oil prices recently have moved up on a point and figure chart on the long-term upward trend, but this holds much less importance compared to the $55 resistance level that should be the main level to watch for right now as 4 times over the last two years, oil prices have failed to move past this level only to retreat down to its main trading range and sometimes lower.
Crude Oil is having a strong last month (up ~9%) and quarter on a near-term basis, but is still down -3% YTD and is trailing other opportunities like U.S. Equities and International Equities from a relative strength standpoint and performance standpoint for a long-term outlook. Of course, just like any commodity, we will continue to watch for major production surprises or supply constraints that could affect the long-term relative strength outlook of Crude Oil.
S&P/TSX Composite Index (TSX.I)
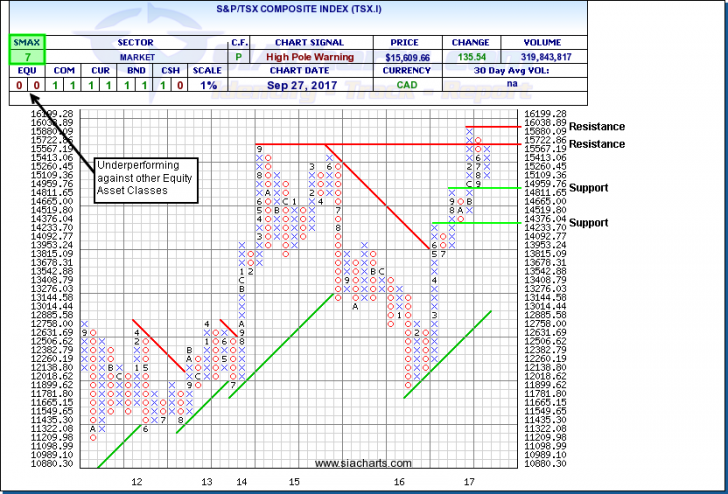
As mentioned in the introduction, the S&P/TSX Composite Index (TSX.I) has moved to positive territory up ~2.1% YTD. Most of this recent positive performance from the TSX.I, as it is up ~3.7% over the last month, has come from the Energy sector. We already went into our analysis of Crude Oil above, so if Energy hits any resistance in the near-term, we could also see the TSX.I affected as well since Energy makes up over 20% of this index.
Looking at a 1% Point and Figure chart for the TSX.I gives us more information about its recent movement than the 2% chart at this time. You can see on the chart that the TSX.I had a pullback over the summer in a column of O’s (and as seen by the 6, 7, 8, 9 on the second to last chart column) that pulled back to the first Support level at 14,811. Further support below this is found at 14,234 on a 1% chart. Then, the TSX.I had a 3-box reversal this month moving towards the first resistance level at 15,723 which it has just moved up against. The main resistance level is found at 16,039 which is the high from earlier this year and the all-time high of the index that will be the main level to keep an eye on moving forward.
SIACharts.com specifically represents that it does not give investment advice or advocate the purchase or sale of any security or investment. None of the information contained in this website or document constitutes an offer to sell or the solicitation of an offer to buy any security or other investment or an offer to provide investment services of any kind. Neither SIACharts.com (FundCharts Inc.) nor its third party content providers shall be liable for any errors, inaccuracies or delays in content, or for any actions taken in reliance thereon.
For a more in-depth analysis on the relative strength of the equity markets, fixed income, commodities, currencies, etc. or for more information on SIACharts.com, you can contact our sales and customer support at 1-877-668-1332 or at siateam@siacharts.com.
Copyright © SIACharts.com