by LPL Research
Fixed income has benefited from recent risk-off moves related to rising tensions with North Korea, the weather, and the debt ceiling, which caused the U.S. 10-year Treasury to hit its year-to-date low yield (high price) of 2.04% on Thursday, September 7, 2017.
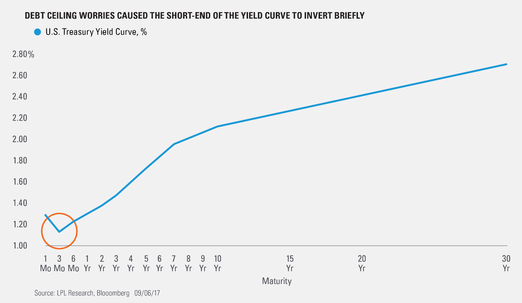
As discussed in a previous blog post, concerns of a political stalemate on the debt ceiling have been ongoing and showed themselves again on Tuesday, September 5 when the Treasury auctioned $20 billion in 1-month (4-week) T-Bills. The auction finished with the bills pricing to yield 1.30% (almost as much as the 2-year Treasury bill was yielding at the time, see chart below) as auction participants demanded a higher rate since the bills will mature in early October, which at the time was after the date the Treasury would run out of cash if the debt ceiling were not raised. This was the highest yield (lowest price) on T-bills since 2008, signaling that traders were concerned that a difficult path to a debt ceiling hike may have been ahead.
However, the fear of a protracted debt ceiling debate was short lived when the President and Democratic leaders reached a deal on Wednesday, September 6 to extend the government’s borrowing authority until December 8, 2017. Following this announcement, the yield on the 1-month Treasury fell, and the short end of the curve, was no longer inverted by the end of the day.
The fact that the short end of the yield curve is no longer inverted indicates that the debt ceiling is a less pressing issue for markets in the near term. However, we will continue to monitor bonds that mature after the new December deadline to gauge whether debt ceiling worries begin to resurface.
*****
IMPORTANT DISCLOSURES
Past performance is no guarantee of future results. All indexes are unmanaged and cannot be invested into directly.
The opinions voiced in this material are for general information only and are not intended to provide or be construed as providing specific investment advice or recommendations for any individual security.
The economic forecasts set forth in the presentation may not develop as predicted.
Government bonds and Treasury bills are guaranteed by the U.S. government as to the timely payment of principal and interest and, if held to maturity, offer a fixed rate of return and fixed principal value. However, the value of fund shares is not guaranteed and will fluctuate.
Yield Curve is a line that plots the interest rates, at a set point in time, of bonds having equal credit quality, but differing maturity dates. The most frequently reported yield curve compares the three-month, two-year, five-year and 30-year U.S. Treasury debt. This yield curve is used as a benchmark for other debt in the market, such as mortgage rates or bank lending rates. The curve is also used to predict changes in economic output and growth.
This research material has been prepared by LPL Financial LLC.
To the extent you are receiving investment advice from a separately registered independent investment advisor, please note that LPL Financial LLC is not an affiliate of and makes no representation with respect to such entity.
Not FDIC/NCUA Insured | Not Bank/Credit Union Guaranteed | May Lose Value | Not Guaranteed by any Government Agency | Not a Bank/Credit Union Deposit
Securities and Advisory services offered through LPL Financial LLC, a Registered Investment Advisor Member FINRA/SIPC
Tracking #1-642514 (Exp. 09/18)
Copyright © LPL Research


