by Ryan Detrick, LPL Research
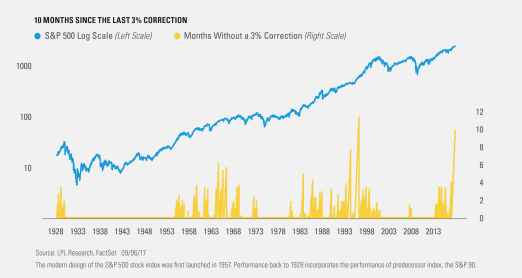
Think about this: the last time the S&P 500 Index was more than 3% away from its all-time high was November 7, 2016. That means there have been 10 consecutive months without so much as a 3% correction in the S&P 500.
In mid-August we recommended Taking A Little Risk off The Table; we believe the bull market will continue and our longer-term outlook for the economy looks good. However, several near-term catalysts could trigger a bout of volatility, and being more prudent at this point in the economic cycle also makes sense. Per Ryan Detrick, Senior Market Strategist, “Consider that the S&P 500 has closed higher 17 of the previous 18 months on a total return basis. Trees don’t grow forever and neither do bull markets. Things still look good, but 10 months without a 3% correction is now the second longest streak ever and is adding to our conviction in being more cautious here and now.”
While we have our concerns, as the chart below shows, most of the long streaks (5 months or more) without a 3% correction took place amid bull markets, and often, following each one the market ascended. For example, long streaks without a 3% correction took place in the mid ‘60s, early ‘80s, and mid ‘90s – all times that saw continued gains well after the initial 3% correction. This likely suggests that should the inevitable correction come, the bull market isn’t near its end; it’s more likely taking a breather.
IMPORTANT DISCLOSURES
The opinions voiced in this material are for general information only and are not intended to provide or be construed as providing specific investment advice or recommendations for any individual security.
Past performance is no guarantee of future results.
The economic forecasts set forth in the presentation may not develop as predicted.
Investing in stock includes numerous specific risks including: the fluctuation of dividend, loss of principal and potential illiquidity of the investment in a falling market.
The S&P 500 Index is a capitalization-weighted index of 500 stocks designed to measure performance of the broad domestic economy through changes in the aggregate market value of 500 stocks representing all major industries.
This research material has been prepared by LPL Financial LLC.
To the extent you are receiving investment advice from a separately registered independent investment advisor, please note that LPL Financial LLC is not an affiliate of and makes no representation with respect to such entity.
Not FDIC/NCUA Insured | Not Bank/Credit Union Guaranteed | May Lose Value | Not Guaranteed by any Government Agency | Not a Bank/Credit Union Deposit
Securities and Advisory services offered through LPL Financial LLC, a Registered Investment Advisor
Member FINRA/SIPC
Tracking #1-641494 (Exp. 09/17)
Copyright © LPL Research


