by Ryan Detrick, LPL Research
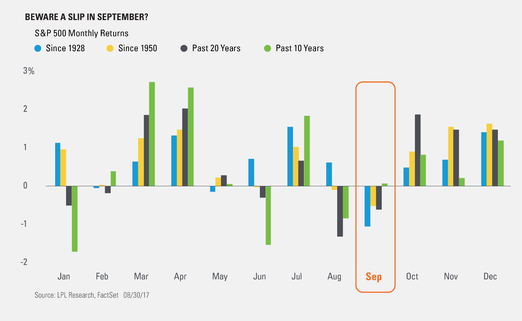
Well, here it comes—September. It’s widely considered the worst month of the year for equities for good reason since it has historically seen the worst performance. Per Ryan Detrick, Senior Market Strategist, “September is the banana peel month, as some of the largest dips tend to take place during this month. Although the economy is still quite strong, this doesn’t mean some usual September volatility is out of the question—in fact, we’d be surprised it volatility didn’t pick up given how calm things have been this year.”
With the Federal Reserve, Bank of Japan, and the European Central Bank all set to announce interest rate decisions this month, and the S&P 500 Index up on a total return basis nine consecutive months as of the end of July, the stage is set for some fireworks in September.
Here’s some data to consider about September:
• Since 1928, no month sports a lower average return than September, with the S&P 500 down 1.0% on average. February and May are the only other months that are generally in the negative, while July surprisingly tends to be the strongest month of the year.
• Since 1928, the S&P 500 has been higher in September only 43.8% of the time, which is by far the lowest amount—as no other month is less than 50%. December is up most often at 73.0%.
• Since 1950, September has been the worst month of the year down 0.5%, while the past 20 years it has been the second weakest month, with August faring worse.
• The worst September ever for the S&P 500 resulted in a 30% drop in 1931. In fact, no other month has had more 10% drops than September at seven. Interestingly, January is the only month that has never been down 10% or more.
• Over the past 10 years, September has been positive on average, with the S&P 500 up 0.1%. But it is worth noting that September has been lower each of the past three years.
• Since 1950, if the S&P 500 starts the month of September above its 200-day moving average (like 2017 will), it tends to do much better, as it is up 0.4% on average versus down 2.7% if it starts the month below the 200-day moving average.
• Last, August is historically a weak month as well. Generally, when the S&P 500 is lower in August what we tend to see in September is that the month is down as well. On average it’s been down 0.4%, right in line with the average monthly return.
IMPORTANT DISCLOSURES
*Please note: The modern design of the S&P 500 stock index was first launched in 1957. Performance back to 1950 incorporates the performance of predecessor index, the S&P 90.
The economic forecasts set forth in the presentation may not develop as predicted.
The S&P 500 Index is a capitalization-weighted index of 500 stocks designed to measure performance of the broad domestic economy through changes in the aggregate market value of 500 stocks representing all major industries.
The 200-day moving average (MA) is a popular technical indicator which investors use to analyze price trends. It is the security or index’s average closing price over the last 200 days.
Investing in stock includes numerous specific risks including: the fluctuation of dividend, loss of principal and potential illiquidity of the investment in a falling market.
The opinions voiced in this material are for general information only and are not intended to provide or be construed as providing specific investment advice or recommendations for any individual security.
Past performance is no guarantee of future results.
This research material has been prepared by LPL Financial LLC.
To the extent you are receiving investment advice from a separately registered independent investment advisor, please note that LPL Financial LLC is not an affiliate of and makes no representation with respect to such entity.
Not FDIC/NCUA Insured | Not Bank/Credit Union Guaranteed | May Lose Value | Not Guaranteed by any Government Agency | Not a Bank/Credit Union Deposit
Securities and Advisory services offered through LPL Financial LLC, a Registered Investment Advisor
Member FINRA/SIPC
Tracking # 1-639523 (Exp. 08/18)
Copyright © LPL Research


