
For this week’s edition of the Equity Leaders Weekly, we are first going to have a look at the reaction, or lack there of on the Volatility Index or VIX chart from the continued war of words and ongoing missile tests from North Korea. Then closer to home, with the costliest natural disaster in US history, many are paying special attention to the activity within the insurance stocks; specifically Property and Casualty insurance.
CBOE SPX Volatility Index (VIX.I)
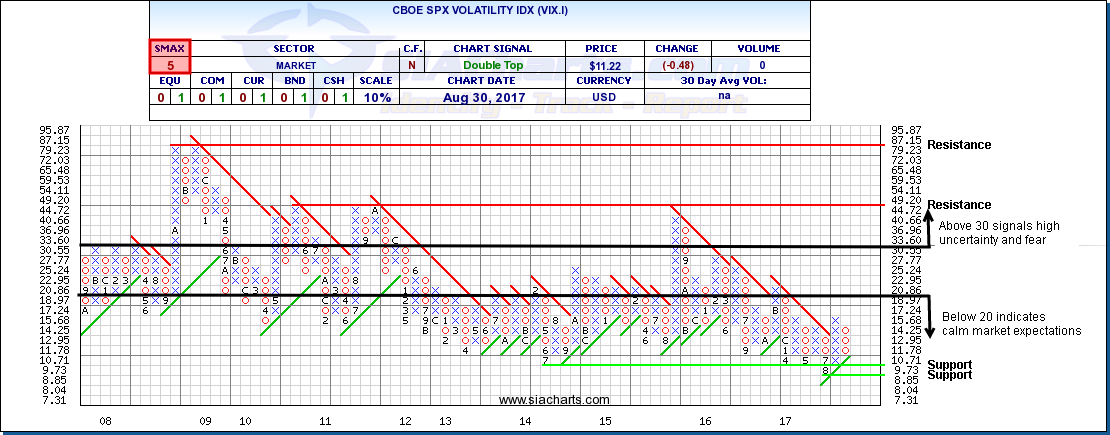
Created in 1993, the Chicago Board Options Exchange (CBOE) Volatility Index (VIX) has become the most popular method of measuring expected volatility. The VIX shows the markets volatility expectations for the next 30 days and does this by tracking both Puts and Calls on S&P 500 index options. Volatility is a measure of how quickly or slowly prices change, and many investors watch this index for extreme volatility because it is generally believed that when the market hits these extremes, it reverses course. For some rules of thumb parameters, a VIX below 20 indicates calm market expectations, and above 30 signals high uncertainty and fear in the markets.
The attached chart gives a long term historical view of the VIX and even with the current tensions with North Korea, the ongoing US political uncertainty, and as well with the major US market indices sitting at or very near all time highs, the reading below that 20 line displays very calm market expectations with very little volatility.
Looking closely at the chart, you will see that the index broke through support at the 10 level late last month; then at the beginning of August with the initial threats from North Korean leader Kim Jong-Un, the VIX rallied over 90% to above 17. Since then, even with the recent test missile flown over Japan, the volatility gauge has pulled back substantially. It seems that these geopolitical tensions and as well the political uncertainty in the US seem to have been accepted by the market.
PowerShares KBW Property & Casualty Insurance Portfolio (KBWP)
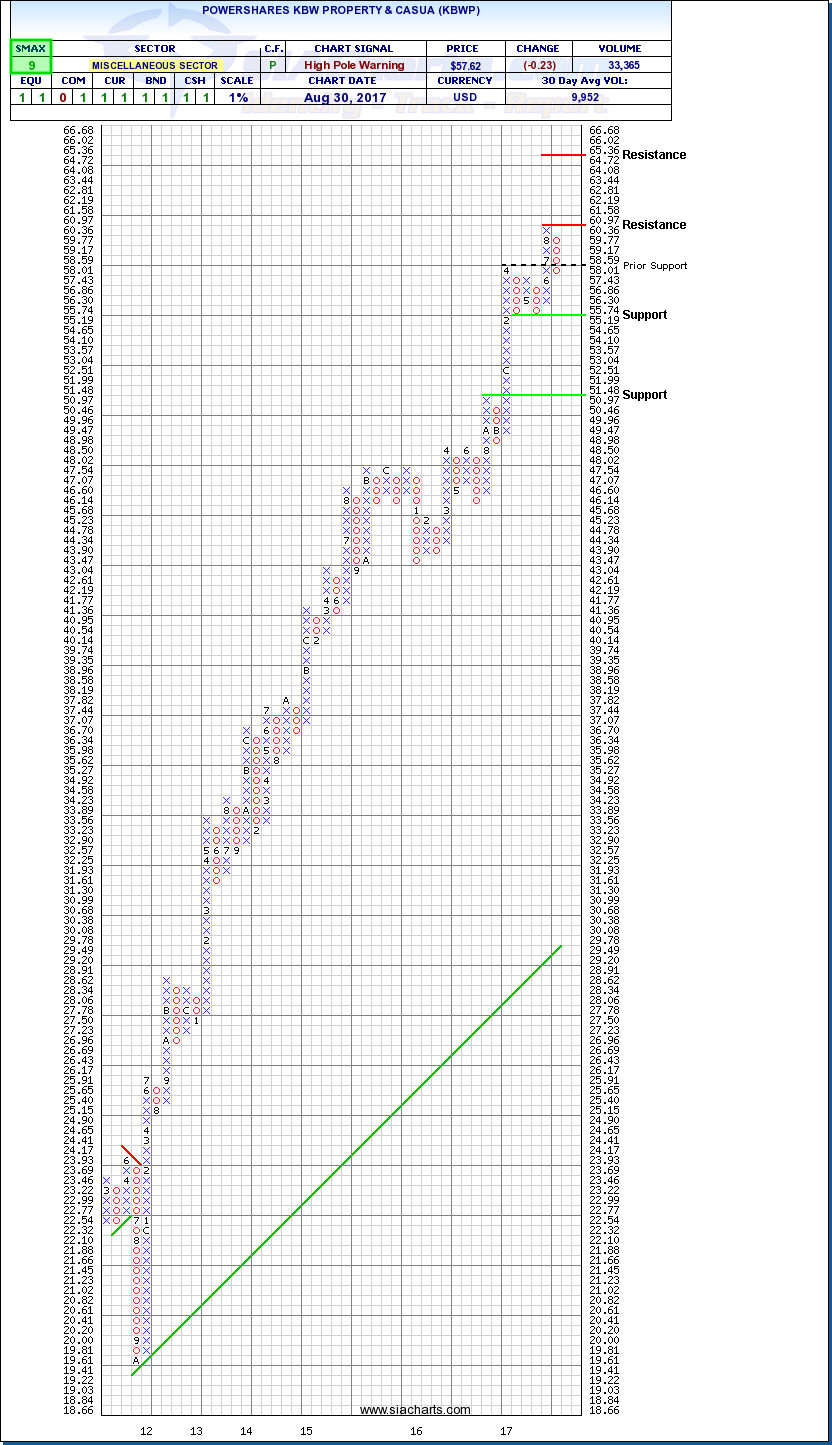
With hurricane/tropical storm Harvey's estimated damages at over $160 billion, investors are obviously looking at the recent price activity in insurance names. For many, the SPDR S&P Insurance ETF (KIE) is the go-to gauge for the US insurance space as a whole, but in order to better pin-point specific companies affected we look to the PowerShares KBW Property & Casualty Insurance Portfolio (KBWP) which seeks to reflect the performance of approximately 24 property and casualty insurance companies. Some well known names within the ETF include Progressive, Allstate, Chubb, Travelers, and Arch Capital Group. Looking at KBWP, we skip the life and health insurers, multi-line insurance, insurance brokers, and reinsurance companies.
In examining the attached 1% scale chart for KBWP (note that we are still in a column of X's on the 2% chart), we can see the recent pullback which is taking place. Though not a dramatic slide at this point, we can see significant support at the $55 level, and then at the $50 mark. It should be noted that this sub-sector of US insurance has been an under performer year-to-date versus the S&P 500. If renewed strength does appear, resistance is seen above $60 and then around $65. With further uncertainty later this week with tropical storm Irma, it will be interesting to see if the current 9 SMAX continues showing near-term strength against all of the asset classes.
SIACharts.com specifically represents that it does not give investment advice or advocate the purchase or sale of any security or investment. None of the information contained in this website or document constitutes an offer to sell or the solicitation of an offer to buy any security or other investment or an offer to provide investment services of any kind. Neither SIACharts.com (FundCharts Inc.) nor its third party content providers shall be liable for any errors, inaccuracies or delays in content, or for any actions taken in reliance thereon.
For a more in-depth analysis on the relative strength of the equity markets, bonds, commodities, currencies, etc. or for more information on SIACharts.com, you can contact our sales and customer support at 1-877-668-1332 or at siateam@siacharts.com.
Copyright © SIA Charts