For this week's edition of the SIA Equity Leaders Weekly, we are going to update and re-examine Copper (HG.F), which has strengthened significantly since our last discussion on July 20, 2017. Along with Copper we will evaluate the BMO Equal Weight Global Metals ETF (ZMT.TO), which appears to be enjoying some of the same interest and strength as HG.F.
High Grade Copper Continuous Contract (HG.F)
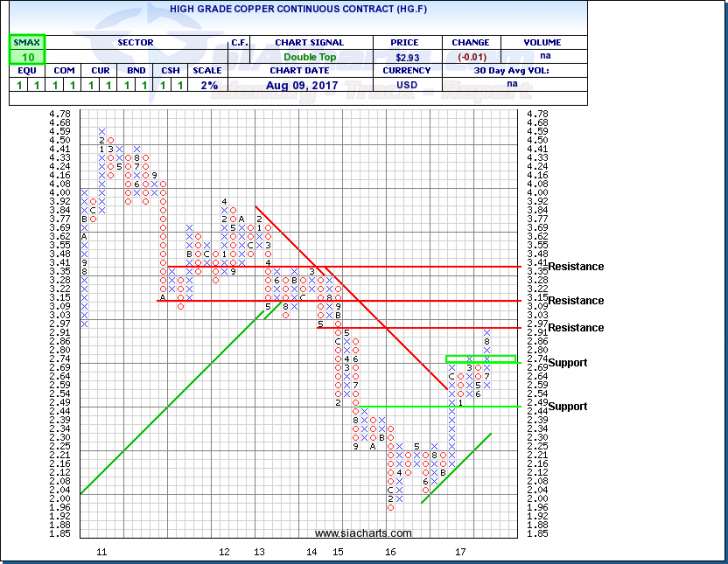
We last examined Copper (HG.F) a few weeks back on July 20, 2017, and although we have seen some weakness in recent days, a firm upwards trend in the commodity remains. Hitting fresh two year peaks recently as soaring steel and iron ore prices in China brightened the outlook for growth and industrial demand in the world’s largest metals consumer has been driving HG.F through previous resistance levels. We see both prior levels of resistance at $2.74 and $2.80 have been broken. Although the chart for Copper today shows a story of strength, we are aware of the caution that is warranted in this commodity's direction and it’s reliance on continued and perceived strength out of such nations as China.
Looking at the chart we can see a clear break above the resistance mentioned between $2.74 and $2.80. Currently sitting right at a prior resistance level from the July 20th chart, of $2.97, a break through this level would open up the possibility of HG.F moving to higher levels, meeting new levels of resistance along the way. First, resistance would be met at $3.15, a move that would be 8% higher from yesterdays close. Next, watch for a material level of resistance to enter at $3.41. Support can now be found at prior resistance between $2.69 and $2.74, with the next level found at $2.49. If we continue to see positive economic news out of China, this trend could continue. With an SMAX of 10 out of 10 now, HG.F is currently showing strength across all the asset classes.
BMO Equal Weight Global Metals ETF (ZMT.TO)
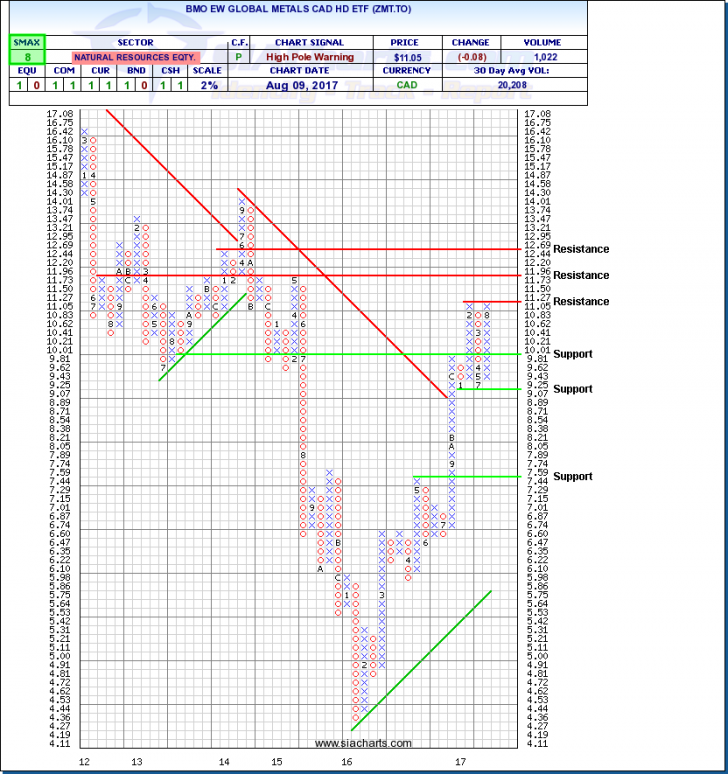
With Metals often being a component of an investors portfolio, it can be argued that a prudent approach to adding such exposure is best done via a diversified ETF such as the BMO Equal Weight Global Metals ETF or ZMT.TO. This ETF provides convenient and efficient exposure to a basket of Global base metals stocks, with the ETF itself often trading in the direction of the underlying commodities these stocks are correlated to. As of June 30, 2017 the YTD return numbers on the ETF is 6.46%, outpacing the broad market indices rather materially. If we continue to see, and the world markets view Chinas economic backdrop as positive, we could see ZMT.TO continue with its path of recent strength.
Since entering the Favored Zone of the SIA All CAD ETF Report at the beginning of July, ZMT.TO has continued to strengthen from ~$9.92 to the close yesterday of $11.05. A return of about 10% over exactly a month. With its first level of resistance coming in at $11.27, the next material level of resistance comes in at $11.96. After that we would look to $12.69. With a few days of weakness behind us, we are watching for the first level of material support to enter just below $10 at $9.81. The next level of support will be found at $9.07 and then not again until mid $7’s. With a positive SMAX of 8, ZMT.TO is exhibiting strength across most of the asset classes.
SIACharts.com specifically represents that it does not give investment advice or advocate the purchase or sale of any security or investment. None of the information contained in this website or document constitutes an offer to sell or the solicitation of an offer to buy any security or other investment or an offer to provide investment services of any kind. Neither SIACharts.com (FundCharts Inc.) nor its third party content providers shall be liable for any errors, inaccuracies or delays in content, or for any actions taken in reliance thereon.
For a more in-depth analysis on the relative strength of the equity markets, bonds, commodities, currencies, etc. or for more information on SIACharts.com, you can contact our sales and customer support at 1-877-668-1332 or at siateam@siacharts.com.
Copyright © SIACharts.com