
by Jeremy Grantham, GMO LLC
Why Are Stock Market Prices So High?
(The market has always loved variables that make it feel comfortable and it has them now.*)
With an unexpected contribution from Ben Graham
Summary
• Contrary to theory, the market P/E level does not primarily reflect future prospects. It reflects current conditions.
• The variables it weights heavily are not academically or economically correct, but those that make investors feel comfortable.
• High profit margins and stable, low inflation dominate this feel-good list, with stability of GDP growth (as opposed to actual growth) a distant third.
• Investors’ extreme preference for comfort, like human nature, has never changed. (Tested back to 1925.) This is unlike financial and economic conditions, which have very substantially changed in the last 20 years.
• The ebb and flow of these variables explain previous market peaks and troughs. These comfort factors, for example, have been at an extremely high average level for 20 years (as have P/Es) and remain so today. Thus today’s high priced market is the completely usual response from investors.
• Any shift back to a lower P/E regime must therefore be accompanied by a major sustained fall in margins or a sustained rise in inflation (or both).
• And, yes, I do believe these comfort variables will move to be less favorable. But probably not quickly.
* My PhD thesis title would have been, “The Persistent Dominance of Superficially Appealing But Economically Inappropriate Market Influences.”
Introduction
In an investing and economic world in which almost everything seems to have changed in the last 20 years, one thing has remained constant: human nature. And, we can more or less prove it. At least in the case of the stock market.
The behavioral drivers of P/E ratios
Ben Inker and I designed a simple model 15 years ago to explain the shifts in P/E levels of the S&P 500. Recently we updated it. Our model does not attempt to justify the P/E levels as logical or deserved, nor does it attempt to predict future prices. It just shows what has tended to be the market’s typical response over the years to major market factors. By far, the two most important of these are profit margins, the higher the better, and inflation, where stable and lower is better, except not too low.
The market’s responses are typically quite different from what one might expect from an efficient market. Let us start with profit margins. In a rational world, stocks should sell at replacement cost. And therefore, above-average margins require a below-average P/E. An alternative way of viewing this is that above-average margins can be expected to mean revert – to move back to average – and vice versa. In real life, though, even in the past when margins were provably very mean-reverting, the market has always preferred high margins. Investors would dependably pay up for high margins, which would then decline, whacking them on the way down. Subsequently, investors would avoid markets with low average margins, which would then recover, causing them to underperform.
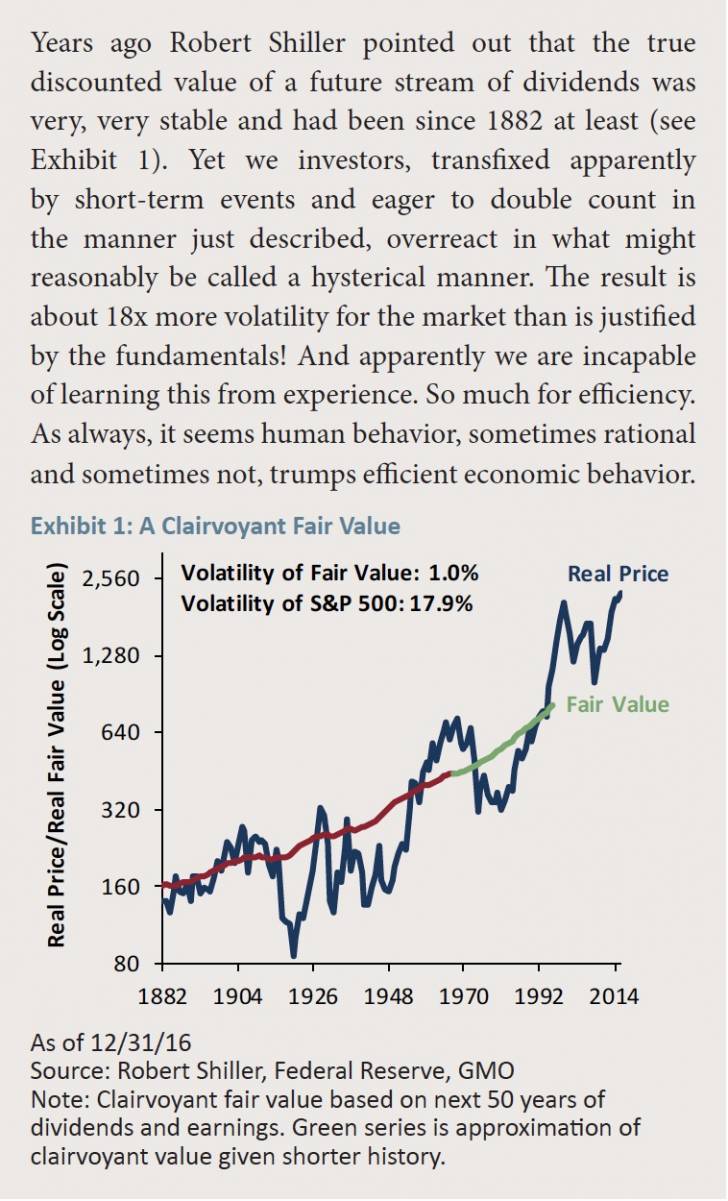 Over and over again. This, in short, was primitive double counting. In 1974 or 1982, for example, at cosmic market lows, very, very depressed margins would sell at equally depressed P/Es of 6x or 8x, producing a price to book (or Tobin’s Q) of one-quarter or one-third. Conversely, at market peaks like 2000, record margins were multiplied by record P/Es, producing 3x price to book. This double counting is a major market inefficiency, perhaps the major inefficiency, and the main reason why market volatility is many multiples of the stately moves in the theoretical future value of dividends. To sell at fair value – true replacement cost – profit margins must be negatively correlated with P/Es, yet in the real world they are strongly positively correlated. And always have been.
Then there’s inflation, which the market hates despite a history of stocks proving that their fundamentals are robust in the longer term in passing inflation through to consumers. Stocks, unlike bonds, are clearly real assets, so inflation should not matter. But in real life, when inflation first appears or accelerates, there is an immediate, coincident negative effect on P/E multiples. (Modigliani, one of the very few economists who seemed to understand how inefficient the market was capable of being, visited a Boston brokerage house in the depths of 1974, when the market was 7x, and made this point eloquently over lunch. He explained that because inflation was irrelevant to long-term value, the market should always be at replacement cost, or twice the then price. Which it obediently moved to in the following two years. Not a bad call. Unfortunately, he seemed to be uninterested in doing serious academic work on the stock market. Had he done so, the belief in market efficiency might have been less of an expensive and dangerous proposition for society. Counting on rational behavior – or even reasonable behavior – from an investment world that overresponds to inflation and can’t even get the sign right for the effect of profit margins can be expensively misleading. As Kindleberger said, this kind of faith in market efficiency “ignores a condition for the sake of a theory.”)
A third behavioral factor, which we first modeled 16 years ago and still has explanatory power, although much less than the first two, is the volatility of GDP growth. Notice that this is absolutely not the growth rate of GDP. I have spent a few decades with traditional portfolio managers and I can guarantee that they are made nervous by rapid GDP changes, even on the upside. Changes make them fear more bumps in the road than normal. Rather, they love stable GDP growth, with few surprises, where they can feel more in control of their own predictions. And in such a world P/Es tend to be higher when GDP growth is stable, not when it is high. (By a strange coincidence, on June 28 the Wall Street Journal presented a chart showing global GDP volatility that has this very last month as the lowest in their 44 years of data!)
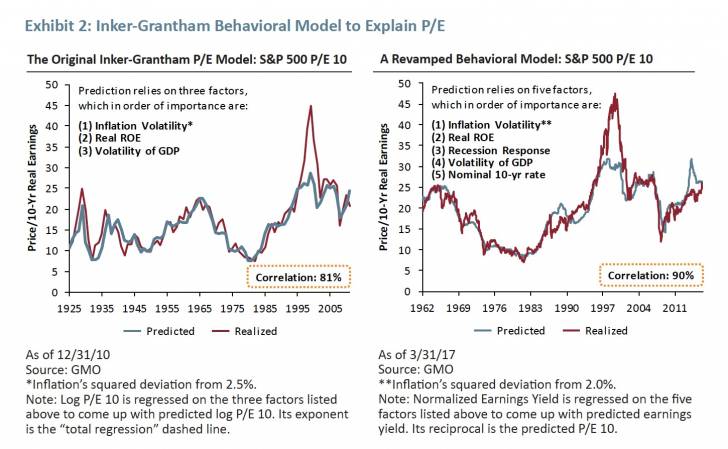
During the updating last year of our behavioral P/E model, we added two new factors, which we believe provide a little further value. The first addition was an on-off switch, which causes P/Es to be a bit lower after a down quarter. Again, not a very scientific reflex in a mean-reverting world, but understandable. The second was to add the US 10-year bond rate, where higher rates are negative, modestly improving the model even after the inflation component had done the heavy lifting for nominal interest rates.
Exhibit 2 shows our original model from 1925 through 2006 compared to actual Shiller P/E (current price over trailing 10-year average earnings). The overall fit is pretty good, but it is much better than that at extremes. In the past, the model explained a record high P/E in 1929, extreme lows in the 1930s, another high in 1965, extreme lows in 1974 and 1982, and a world record high, by a wide margin, in 2000. The outlier nature of the market peak in 2000 – confirmed in our updated version – suggests something interesting: Market peaks (1929, 1972, 1987, and 2008) and market troughs (1932, 1974, 1982, 2002, and 2009) were more or less – and more rather than less – what you should have expected from investors pressured with the comfortable (and uncomfortable) news at the time, as reflected in our model. For those events, you don’t need any further bubble or bust explanations. They were normal behavioral responses to extreme data. This behavioral model seems, in that sense, like a parallel universe to all our other investment thinking on bubbles. Only 2000 stands out, fully one-third higher than “explained,” as a genuine bubble, beyond these normal factors. The reader can surely pity investors who were hung out to dry in that extra and extraordinary one-third! Even the memory still stings.
Exhibit 2: Inker-Grantham Behavioral Model to Explain P/E
We might reasonably conclude from this finding that any large and more or less permanent decline in the market (i.e., to a new, lower trend, much more like the 1945 to 1995 period than today) would require an equally large deterioration in profit margins or increase in inflation or some combination. Without either, any large market decline would be very unusual historically and likely, I believe, to be temporary. I can conclude this point by offering my personal opinion for 2017 on the two most important factors: favorable for margins and unfavorable for inflation. If only life were easy! But, even if these guesses prove to be correct, this mixed signal does not suggest a major decline or perhaps any decline.
For the record, if you need yet another rebuttal of the Lucas/Fama and French model of economic efficiency on the part of investors, this model is it: a long-term testimonial, and a very stable one, to investor behavior that they would have to describe as inefficient by their definition. And though this investor behavior may be loosely described as rational, it is certainly economically and financially innumerate. I am happy to say that I never believed a word of their theory on the efficiency of the market, which I have always thought is better described as a behavioral jungle. But having said that, I must admit to having detracted from my usefulness as an investor by assuming that investors overall would at least respond sensibly most of the time to the data they are given. And they do not. The effectiveness and persistency of our behavioral model, almost all the components of which should not work in a resolutely sensible world, let alone an efficient one, should have persuaded me to change my thinking years ago. But, here I am, trying to explain during these last nine months or so why the general discount rate of assets has dropped by roughly two percentage points from the 1900 to 1997 average. My proposed reasons for the reduced discount rate come down to a complicated stew of factors, most of which interact with the others: higher profit margins; higher leverage; lower rates; aggressive Fed and central bank policies to push rates lower; moral hazard from the Fed that may be more important than rates – the asymmetry of helping in bad times and letting good times run; changes in the age profile of the developed world; slower population growth; lower productivity; lower GDP growth; less low-hanging technological fruit; loss of the old $16 a barrel oil; extreme income inequality; remarkable lack of progress in median and lower hourly wages; and very much enhanced corporate political and monopoly power. Phew! I truly believe we will never know for sure which factors dominate the equation, although my favorite is Fed policy and the runners-up are an aging population profile and the rising political and monopoly power of corporations. But whichever they were, they got the job done: For the last 20 years profits in the US as a share of GDP and corporate revenues rose by about 30% and P/E ratios by 70% above the old normal.
Now, cutting across that previous attempt to understand these major changes in our new 20-year era, comes an entirely behavioral approach. Whether sensibly or not, investors love high margins and like stable growth even if it’s modest, and hate inflation. They felt this way from 1925 to 1997 and they felt exactly the same way in our new era of 1997 to 2017. So, behaviorally it is absolutely not a new era. It is precisely – to a 0.90 correlation – the same ole same ole. The peaks of 1929 and 1965 delivered favorable margins and inflation inputs but for a very short while in both cases. In contrast, the period of 1997 to 2017 has delivered to investors their preferred conditions almost the entire time, with only two very quick time-outs for market breaks. Can the market really be this easy to explain? Well, it has been for 92 years! And what can we investors do with this information? It tells us that if we re-enter a period of old normal profits and old normal inflation, the market’s P/E will indeed mean revert to its old average. And if we don’t re-enter such a period, the P/Es are likely to stay high. It tells us separately that if we expect a market crash, we should also expect to have a crash in margins (as we did in 2008-09) or a truly dramatic rise in sustained inflation (as we did in 1979-81) or some powerful combination. All of which is possible of course, but I think improbable, at least in the near term. This behavioral approach to explaining shifts in P/Es is certainly a much simpler equation than my previous stew-of-factors approach. But it does have some powerful similarities to my earlier arguments found in Parts 1 and 2 of “Not With A Bang But A Whimper.1 In both approaches, the role of profit margins is dominant. Improved margins not only move the earnings up directly, but also the P/E multiplier applied to those earnings. Inflation is also a strong secondary factor in both approaches, for low inflation, of course, drives down the interest rates, which appear to be an important ingredient in the stew.
So, where does this leave us? It suggests to me that I have in general been over-intellectualizing the working of the market for a few decades. I have had too strong a belief that investors would at least be influenced by past data in a sensible way. The market, however, appears not to care at all about the past or to learn much from it. This model for sure seems to say that for 92 years, at least, the market has with remarkable consistency been a coincident indicator of superficially appealing variables that in a strict economic sense have been inappropriate, and that have caused spectacular and unnecessary market volatility. The model is apparently a reflection of human nature and, of all factors influencing the market, human nature, as economically inefficient and unsophisticated it may be, seems the least likely to change.
Postscript #1: momentum and value
If the short-term behavioral variables described above dominate the short-term market level to the degree shown – a 0.90 correlation – what is the role for both momentum and value? My guess is that there is enough noise in the data for there to be room for many individual stocks to be driven in the short and intermediate term away from fair value by momentum, also a behavioral factor. More importantly for us value managers, I believe there is also enough noise in the data for individual stocks and the market to be pulled back toward replacement cost or fair value. Value (like gravity in physics) is a weak force in the short term, but very, very persistent so it can eventually work its way around the stronger coincident behavioral forces. Value was the beneficiary, after all, of a real world arbitrage: If the market priced a stock too high, management would sell stock and buy more – say, fiber optic cable – until market forces brought the price of the product, the profit margins, and the stock price down. If priced too low, management would buy stock back and reduce the underpricing and, more directly, it would withhold expansion until shortages occurred, sometimes quickly and sometimes drawn out. But more recently, increased monopoly power and other factors appear to have decreased the corporate reflex to expand in favor of stock buybacks, perhaps weakening the previously reliable game. But that of course is the question under consideration.
Postscript #2: a paean to changing your mind when the facts change
Descending out of the blue just before the July 4 weekend came this no doubt heaven-sent recently discovered talk by Ben Graham titled “Securities In An Insecure World,” which was given on November 15, 1963. It is one of the last he gave. After a 40-year career in which he had developed a fairly high-confidence view on how to define the value of the US stock market, he was having second thoughts. Like some of us now. Here are my favorite snippets.
“In early 1955 when I testified before the Fulbright Committee the stock market was then about 400, my central value was also around 400 and the valuation of other ‘experts’ using other methods all seemed to come to about that level. The action of the stock market since then would appear to demonstrate that these methods of valuations are ultra-conservative and much too low, although they did work out extremely well through the stock market fluctuations from 1871 to about 1954, which is an exceptionally long period of time for a test. Unfortunately in this kind of work, where you are trying to determine relationships based upon past behavior, the almost invariable experience is that by the time you have had a long enough period to give you sufficient confidence in your form of measurement just then new conditions supersede and the measurement is no longer dependable for the future.” [Emphasis added. By the way, the deliberate total return from the S&P 500 from the end of 1963 until today has been 5.75% real, exactly what we at GMO assume to be the long-term, normal return.]
“My reason for thinking that we shall have these wide fluctuations – of which we had a taste in 1962, in May particularly – is that I don’t see any change in human nature vis-à-vis the stock market which is sufficient to establish more restraints in the public behavior than it showed over so many decades in the past.”
“But let me point out ‘for the record’ that it is not impossible in theory that the market’s high level alone could sooner or later precipitate a collapse without the necessity for these technical weaknesses [described above, Ed.] to show themselves. The collapse might be triggered by some untoward economic or political development. But if things do happen that way it will be the first time in market history, I believe, that we would have the end of a bull market without the excesses and abuses of the sort I have mentioned.” [Emphasis added.]
“The main need here is for the investor to select some rule which seems to be suitable for his point of view, one which will keep him out of mischief, and one, I insist, which will always maintain some interest in common stocks regardless of how high the market level goes. For if you had followed one of these older formulas which took you out of common stocks entirely at some level of the market, your disappointment would have been so great because of the ensuing advance as probably to ruin you from the standpoint of intelligent investing for the rest of your life.”
Jeremy Grantham. Mr. Grantham co-founded GMO in 1977 and is a member of GMO’s Asset Allocation team, serving as the firm’s chief investment strategist. Prior to GMO’s founding, Mr. Grantham was co-founder of Batterymarch Financial Management in 1969 where he recommended commercial indexing in 1971, one of several claims to being first. He began his investment career as an economist with Royal Dutch Shell. He is a member of the GMO Board of Directors and has also served on the investment boards of several non-profit organizations. He earned his undergraduate degree from the University of Sheffield (U.K.) and an MBA from Harvard Business School.