
by Lance Roberts, Clarity Financial
I know…I know…
There seems to be absolutely nothing that can derail the current bull market.
- Geopolitical conflict – NOPE
- Political intrigue – NOPE
- Fed Reserve reducing liquidity to the markets – NOPE
- Lack of expected tax cuts, reform, and infrastructure spending – NOPE, NOPE, and NOPE.
With markets near records, investors seem to have very little to worry about.
But maybe, it is the very fact that everything seems so ebullient that we should take a bit of a contrarian position. As I wrote previously:
“First, “record levels” of anything are records for a reason. It is where the point where previous limits were reached. Therefore, when a ‘record level’ is reached, it is NOT THE BEGINNING, but rather an indication of the MATURITY of a cycle. While the media has focused on employment, record stock market levels, etc. as a sign of an ongoing economic recovery, history suggests caution. The 4-panel chart below suggests that current levels should be a sign of caution rather than exuberance.”
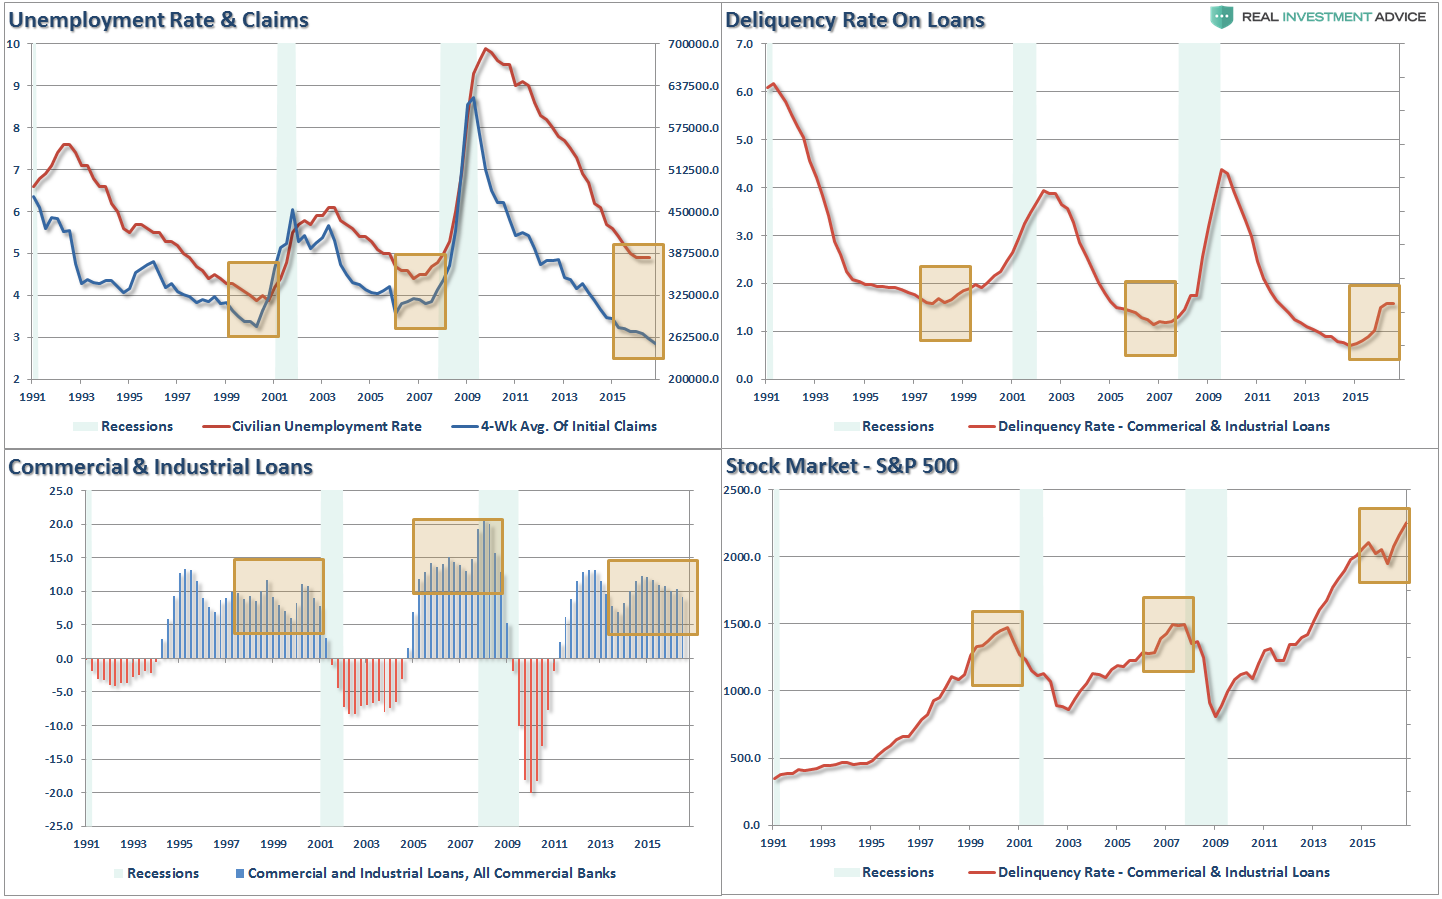
However, while economic data suggests we may closer to the end of the current economic cycle than the beginning, data related specifically to the stock market may also be suggesting the same.
Let’s take a look:
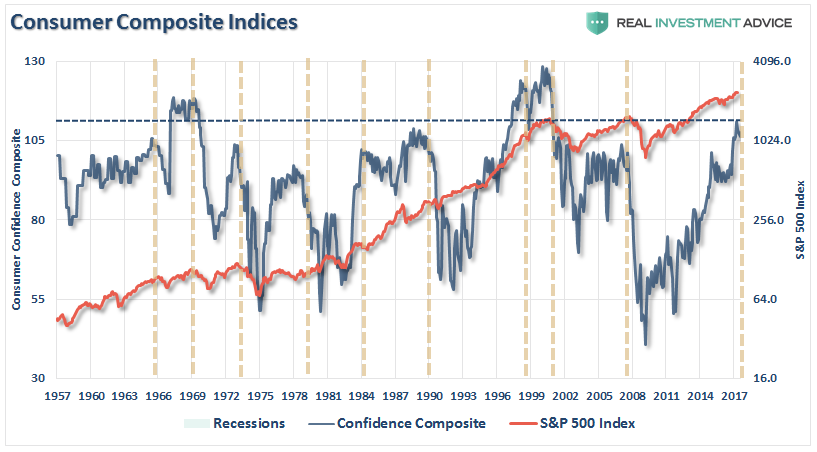
1 – Confidence Levels at 107
The chart below a COMPOSITE confidence index consisting of both the University of Michigan and Conference Board indices. At 107, the index is currently at levels that have historically denoted the end of an economic cycle. (This should be expected as it is the point in the economic cycle where everything is now “as good as it gets.”)
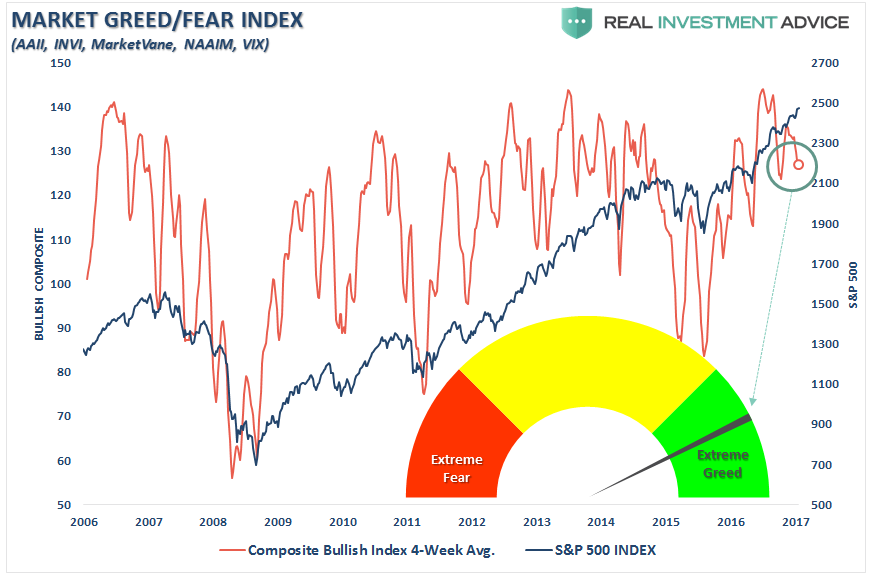
2 – Bullish Sentiment Hits 126 – Greed Levels
The following chart is a composite sentiment index which includes the National Association Of Investment Managers Index, the American Association of Individual Investors and the VIX. Given the combined composite is pushing extreme levels, a bit more caution is likely well advised.
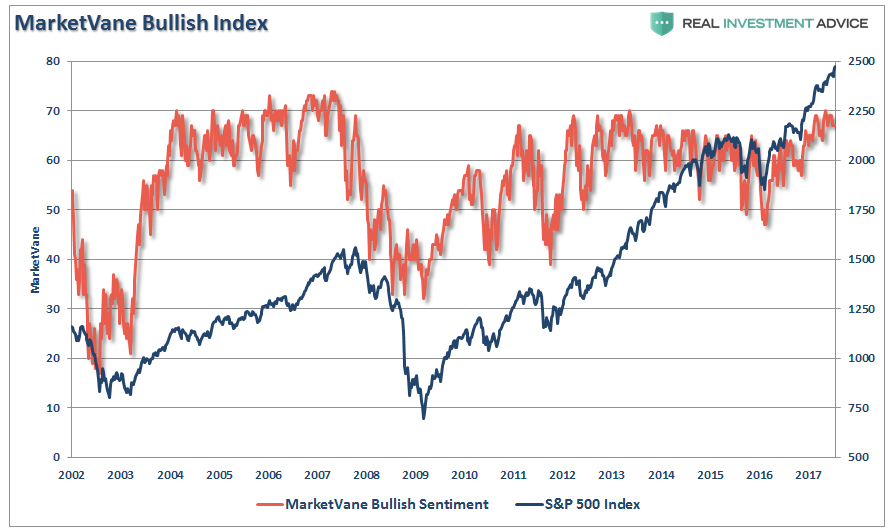
3 – Market Vane Bullish Sentiment: 64%
The Market Vane bullish sentiment index is a yardstick for traders as it measures the number of traders that are long a certain commodity. In this case the S&P 500 index. Currently, at 64%, as with the other indicators above, it is currently reflecting levels of bullishness that have historically been associated with corrective actions.
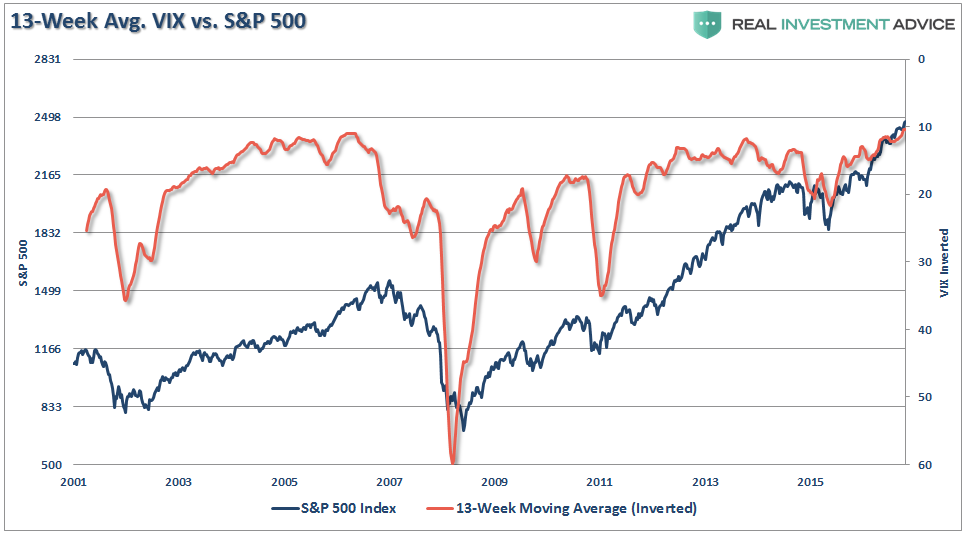
4 – CBOE’s equity volatility index (VIX) @ 9.79 — The S&P’s 65-day rolling volatility (inverted scale) is at levels which typically occur ahead of a corrective phase.
The volatility index shows the market’s expectation of 30-day volatility. It is constructed using the implied volatilities of a wide range of S&P 500 index options. This volatility is meant to be forward-looking, is calculated from both calls and puts, and is a widely used measure of market risk, often referred to as the “investor fear gauge.” When the gauge is at extremely low levels it suggests that investors have little fear of a market reversion. From a contrarian standpoint, this is when corrections have tended to occur.
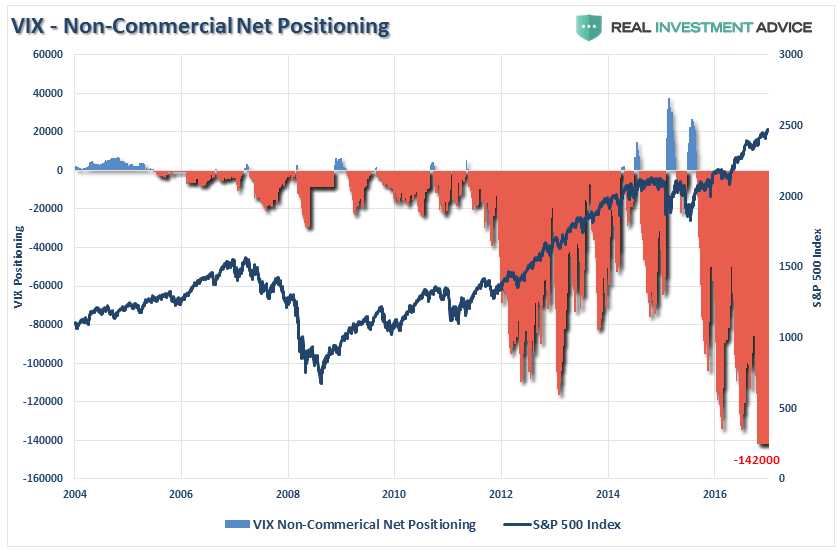
I noted last week the record levels of short positions currently outstanding on the Volatility Index.
“The extreme net-short positioning on the volatility index suggests there will be a rapid unwinding of positions given the right catalyst. As you will note, reversals of net-short VIX positioning has previously resulted in short to intermediate term declines.”
The chart below shows the 13-week moving average (65-day) of the volatility index versus the S&P 500. I have inverted the index to provide a clearer relationship between the two indices. From a contrarian viewpoint, the index currently suggests the risk of a correction outweighs the potential for a further advance.
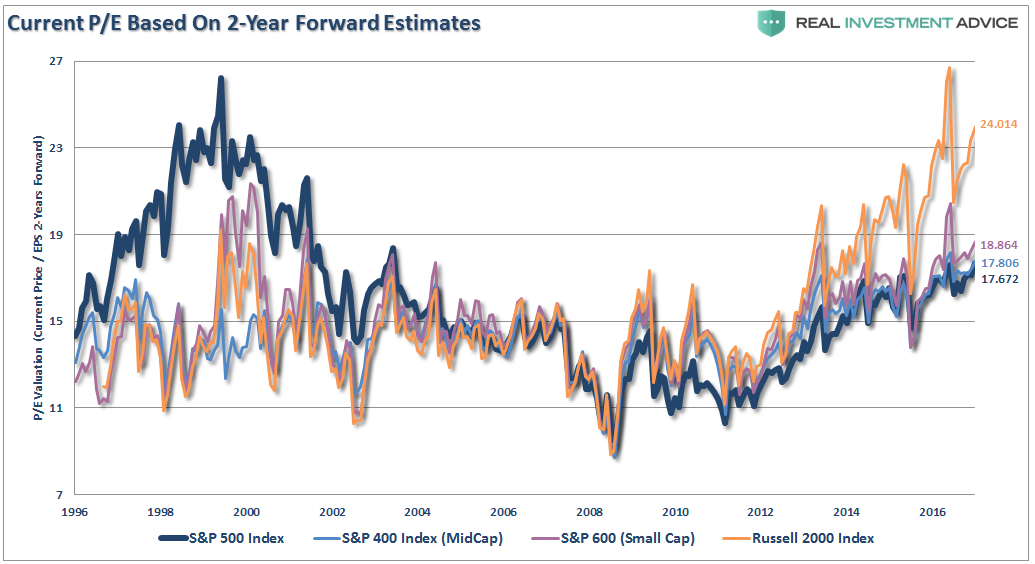
5 – 2-Year Forward P/E multiples: 17.67x S&P 500, 17.81x S&P 400, 18.86x S&P S&P 600 and 24.01x for Russell 2000. All are above long-term means and forward estimates are subject to large downward revisions.
Of course, valuations matter, even for Millennials:
“Over any 30-year period the beginning valuation levels, the price you pay for your investments has a spectacular impact on future returns. I have highlighted return levels at 7-12x earnings and 18-22x earnings. We will use the average of 10x and 20x earnings for our savings analysis.”
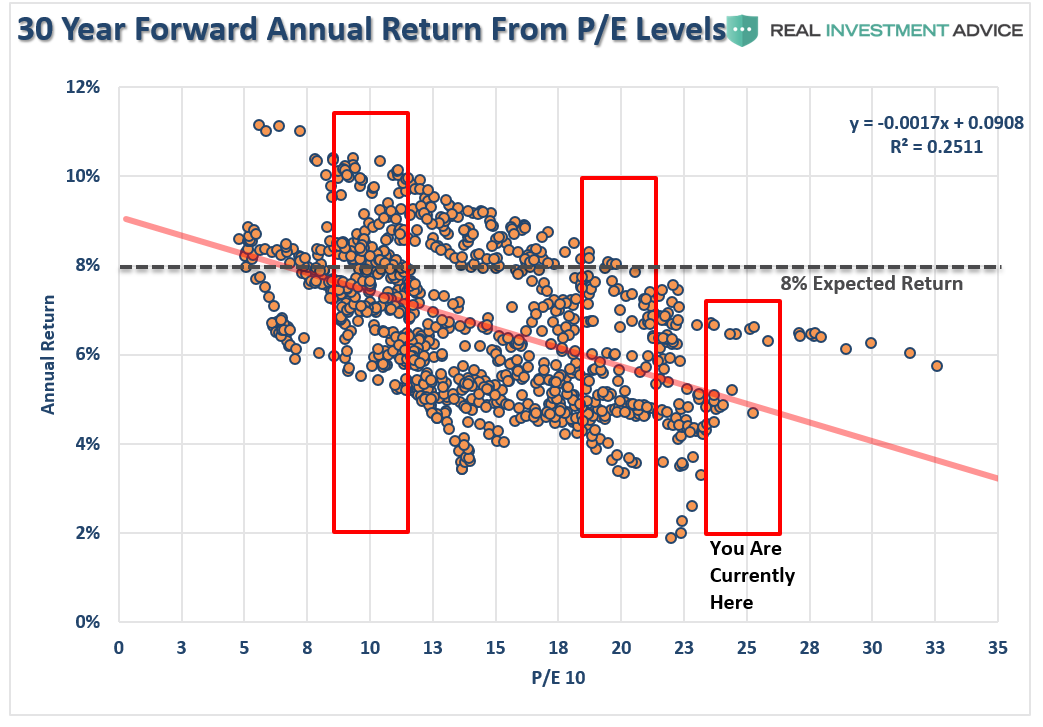
“As you will notice, 30-year forward returns are significantly higher on average when investing at 10x earnings as opposed to 20x earnings or where we are currently near 25x.
The point to be made here is simple and was precisely summed up by Warren Buffett:
‘Price is what you pay. Value is what you get.’”
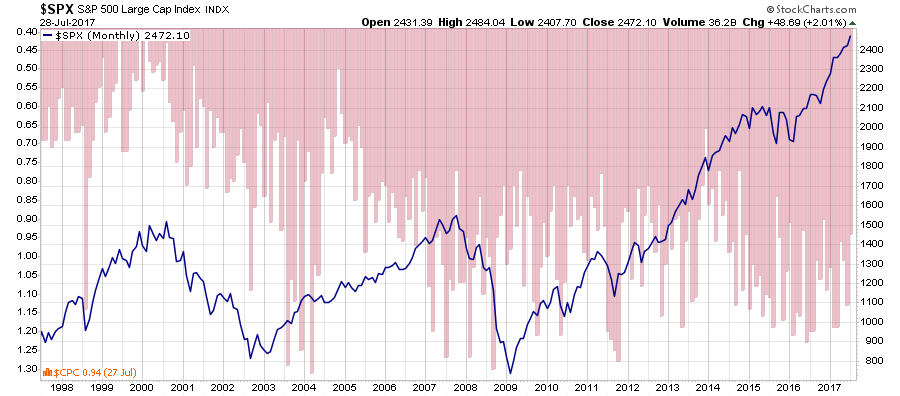
6 – NYSE Put/Call Ratio: 0.94
One way to interpret the put-call ratio is to say that a higher ratio means it’s time to sell and a lower ratio means it’s time to buy. However, traders also view this as a contrarian indicator. Traders know that derivatives are used to do more than place bets; they are used as insurance. If there’s a lot of insurance being placed to the sell side, it means traders are worried about prices falling. Some traders will buy when the put-call ratio is above 1, meaning the market is out of balance to the sell side, and sell when the put-call ratio is below 1, meaning the market is out of balance to the buy side. These traders are looking to make money on the correction.
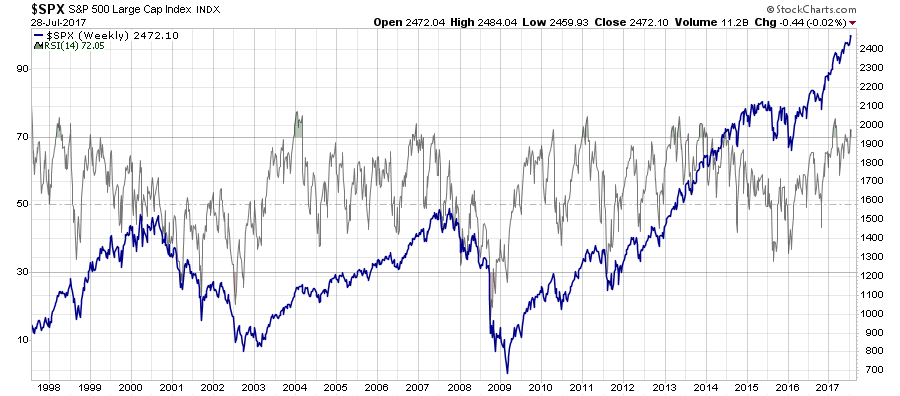
7 – The 14-week RSI (Relative Strength Index) has moved to 72.05, above the 70 level widely viewed as being an “overbought” threshold.
As shown, on a weekly basis there are only a few points where the markets have been this overbought on a weekly basis. With the exception of the 2013-2014, during the $85-billion per month QE program, each previous occasion has triggered a short-term correction or worse.
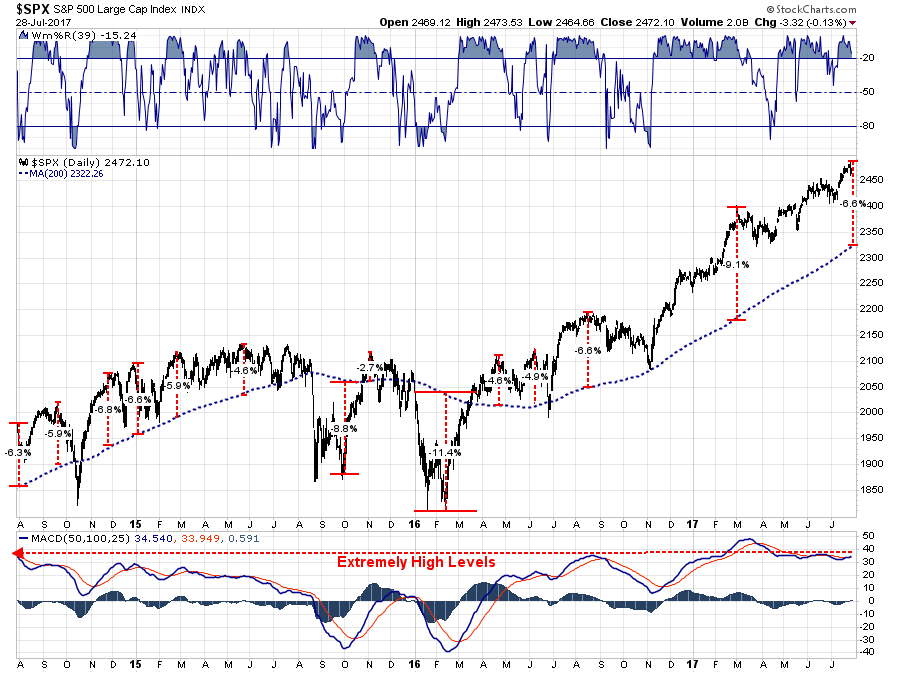
8 – The S&P 500 has now gapped up nearly 7% above its 200-day moving average, another sign of an overextended stock market.
As I have explained numerous times in the past, moving averages are like “gravity.” Prices can only move so far above the longer-term average before the gravitational force exerted causes prices to “revert to the mean.”
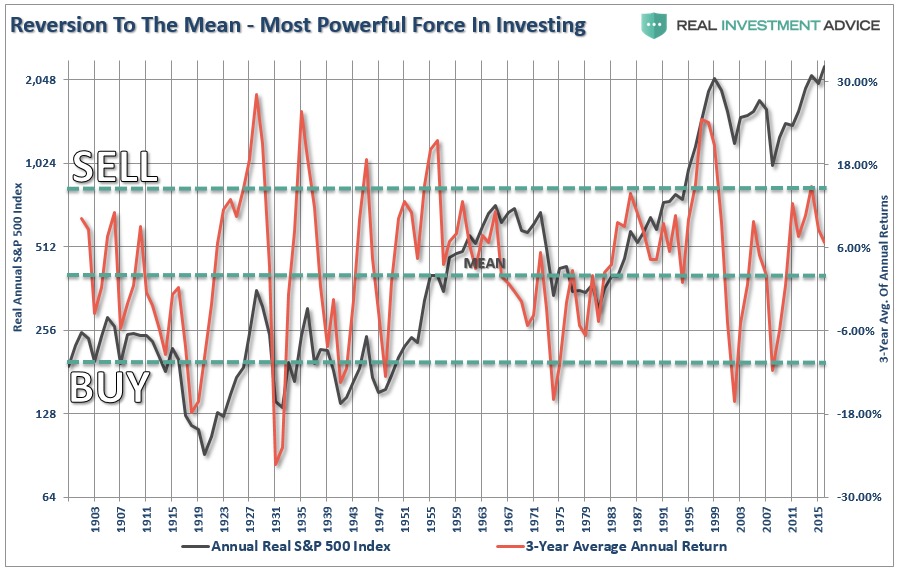
Historically, we find that when price extensions have exceeded a 12% deviation from the 3-year average return of the index, the majority of the market cycle had been completed. While this analysis does NOT mean the market is set to crash, it does suggest that a reversion in returns is likely. Unfortunately, the historical reversion in returns has often coincided at some juncture with a rather sharp decline in prices.
9 – Earnings expectations have significantly lagged market price action — in fact, according to S&P data, analyst EPS projections for 2017 have declined sharply from $121.09 to $117.20/share since the beginning of the year.
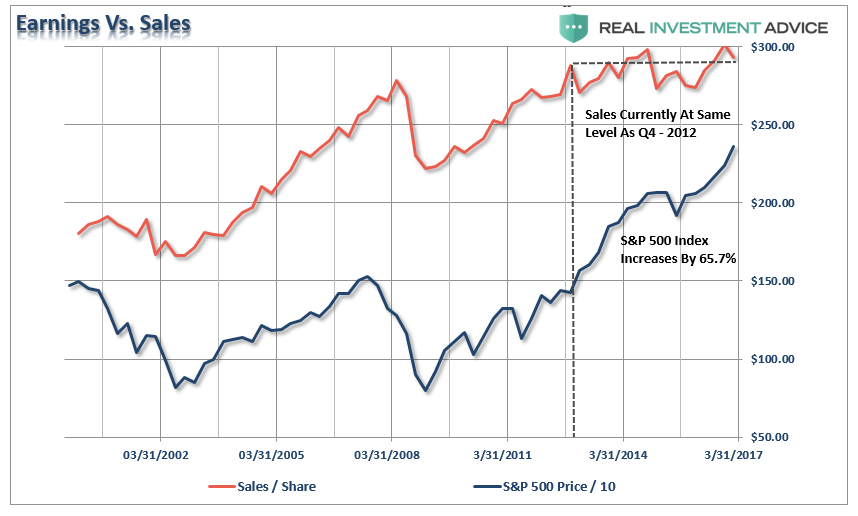
While there is much hope that earnings will eventually play “catch up” to stock prices, there is a significant risk to that outcome. As shown below, sales per share is roughly at the same level as it was in Q4-2012, but stock prices have risen by 65.7% during the same period. With stock prices already “priced to perfection,” any shortfall will likely be problematic.
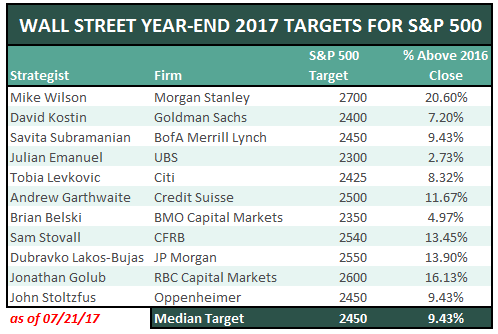
10 – The S&P 500 has already climbed above year-end targets for well over half of the Wall Street strategists out there.
As I laid out at the beginning of this year in “The Problem With Forecasts”, even the most bullish analysts weren’t as optimistic as the market is now.
“Since optimism is what sells products, it is not surprising, as we head into 2017, to see Wall Street’s average expectation ratcheted up another 9.43% this year. Of course, comparing your portfolio to the market is a major mistake, to begin with.”
Conclusion
The problem is that since there is never an expectation the markets can go down, it is just that belief which eventually ensures an investor error.
I recently did a very thorough study showing that even dollar cost averaging from current valuation levels is likely to be disappointing over the next few years. To wit:
“So, with this understanding let me return once again to the young, Millennial saver, who is going to endeavor at saving their annual tax refund of $3000. The chart below shows $3000 invested annually into the S&P 500 inflation-adjusted, total return index at 10% compounded annually and both 10x and 20x valuation starting levels. I have also shown $3000 saved annually in a mattress.”
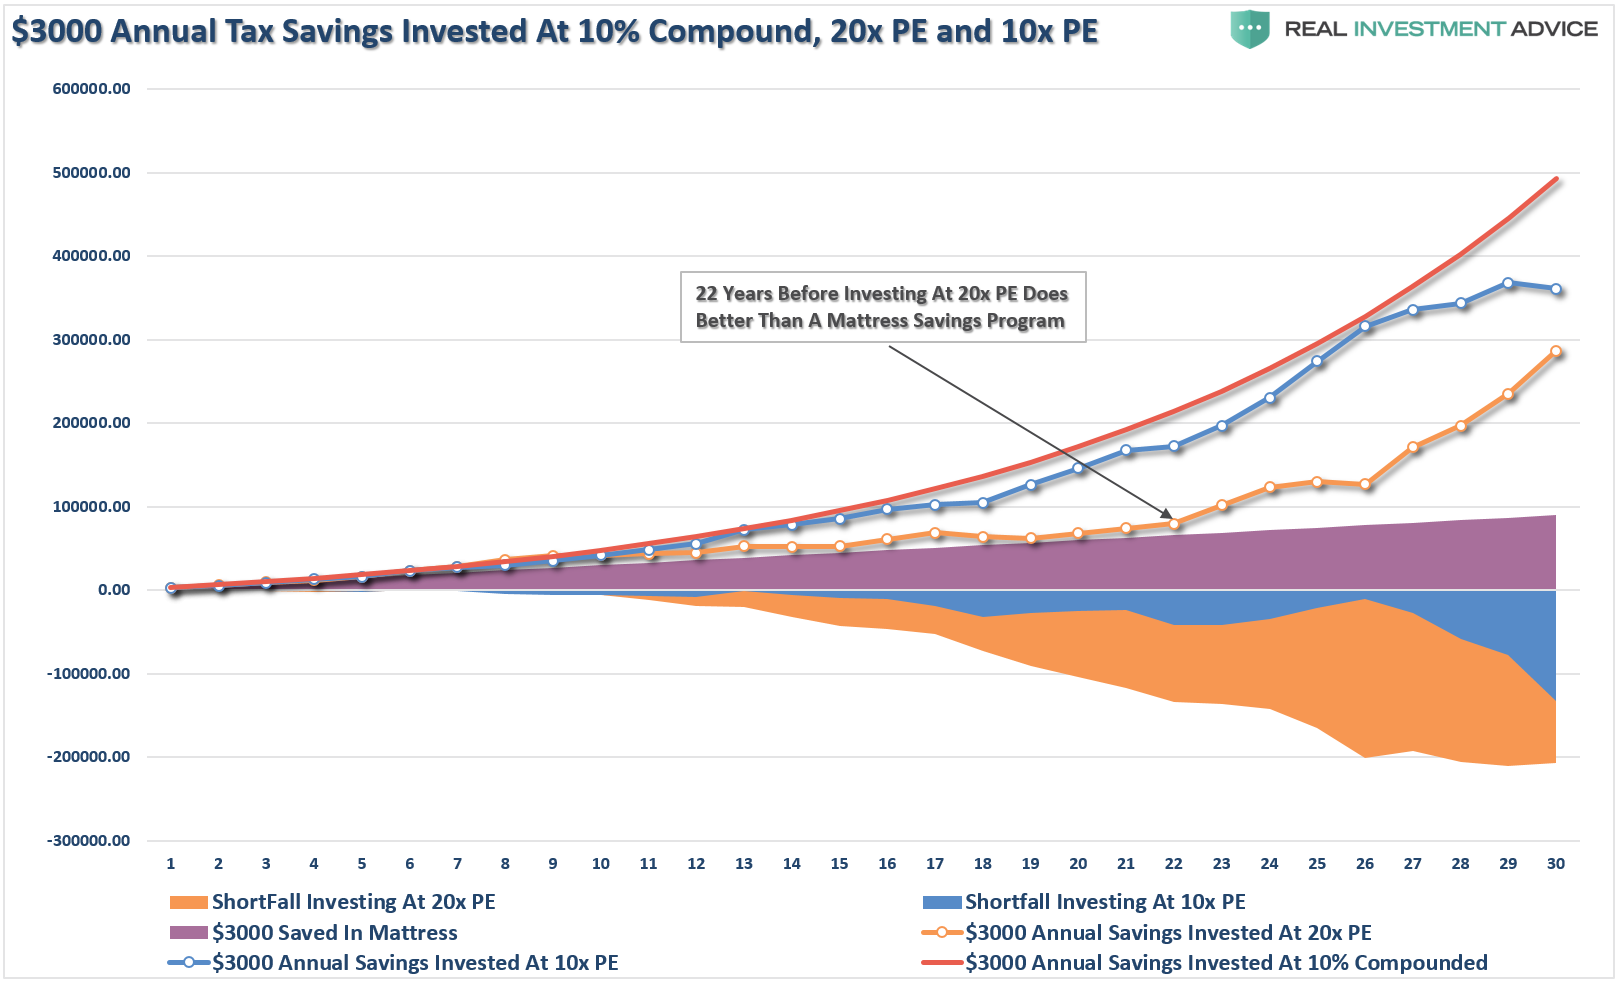
“I want you to take note of the point made that when investing your money when markets are above 20x earnings, it was 22-years before it grew more than money stuffed in a mattress.”
When I returned the study and my findings back to the media outlet, I immediately received a message back stating:
“This is not a message that we want to project.”
In other words, they wanted an article suggesting that Millennials should just “buy everything.”
Maybe that is an indicator within itself.