
For this week’s edition of the Equity Leaders Weekly, we are going to examine how the Copper Commodity (HG.F) has performed with the continued strength in the markets as of late. We will also examine in more detail how the Chinese Stock market has performed given the positive economic data we have seen coming out of the China region most recently by looking at the performance of the iShares MSCI China ETF (MCHI).
iShares MSCI China ETF (MCHI)
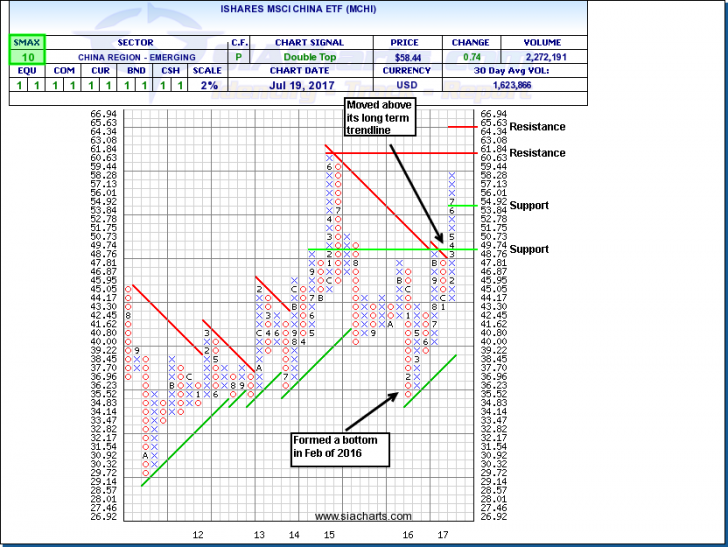
China’s economy expanded faster than expected in the second quarter of 2017 setting the stage to comfortably meet its 2017 growth target. China’s GDP number for the quarter came in at 6.9% which mirrored China’s first quarter GDP number and was higher than the 6.8% analyst expectations for Q2. Going forward, economists now expect that second half 2017 GDP numbers should remain quite robust. These rather impressive GDP numbers have helped China’s major stock indexes rally higher as of late. Let’s examine the iShares MSCI China ETF to see how it has performed given China’s positive economic backdrop.
The iShares MSCI China ETF seeks to track the investment results of an index composed of Chinese Equities that are available to international investors. In looking at the attached chart, we see MCHI had formed a bottom back in February of 2016. After a brief pullback in late 2016 and into January of 2017 we see the shares have reversed course to the upside beginning in February of this year and firmly broke above its longer-term downtrend line in March. With such a strong move up since February, the next level of resistance will be at its 2015 high of $61.84. If it manages to break above this level, the next level of resistance is around the $65.00 level. Support can be found at $53.84, and below that at $48.76. MCHI can be found in SIA’s International Equity Universe Report and currently occupies the Favored zone at the #37 spot within this report. It most recently entered the Favored zone in this report on May 12 at a price of $52.41 which translates to a 11.5% return from its current price in just over a couple of months. With an SMAX score of 10 out of 10, MCHI is showing near term strength against all asset classes.
High Grade Copper Continuous Contract (HG.F)
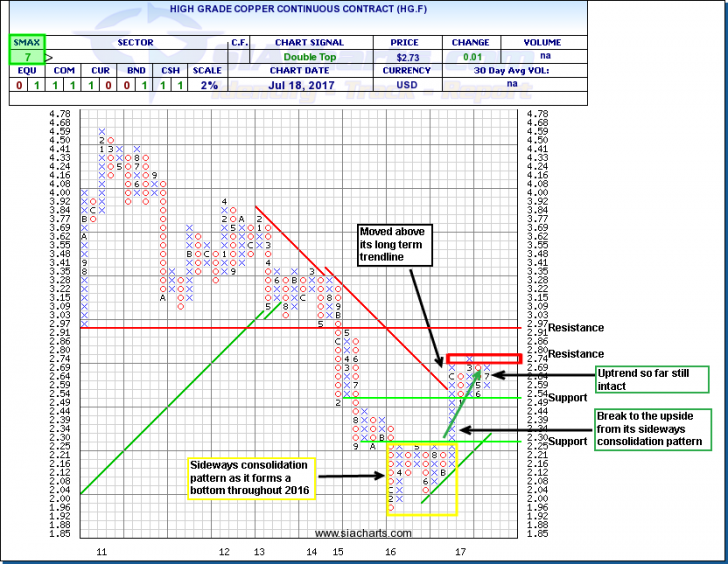
Copper is widely referred to as Dr. Copper for its stigma of being a leading economic proxy, being viewed as an indicator of economic health by some economists. The last time we looked at Copper was back in early April where we may see the early stages of a longer-term uptrend may have forming. With the continued strength in the economic data coming out of China and given the fact China is a large consumer of Copper with its continuing industrial build out, let’s examine the price movement of Copper to see what may lay ahead for this important commodity.
In looking at the attached chart, we see the commodity first broke above its longer-term downtrend line in December of last year after spending the bulk of 2016 in a sideways consolidation pattern, in an attempt to form a bottom. The commodity has been trading in a fairly tight trading range so far this year but the early stages of its uptrend since December is still intact thus far. Most recently we see a column of rising X’s has formed and we are quickly approaching the upper end of its recent trading range at $2.80. The first level of resistance will be found at this upper range of $2.74 to $2.80. If it manages to break above this area, the next level of resistance is at $2.97. Support can be found at $2.49 and, below that, at $2.25. It will be interesting to see in the coming weeks and months if Copper can resume its uptrend given the momentum that seems to be materializing out the China region. With an SMAX of 7 out of 10, it is currently showing near term strength against most asset classes.
SIACharts.com specifically represents that it does not give investment advice or advocate the purchase or sale of any security or investment. None of the information contained in this website or document constitutes an offer to sell or the solicitation of an offer to buy any security or other investment or an offer to provide investment services of any kind. Neither SIACharts.com (FundCharts Inc.) nor its third party content providers shall be liable for any errors, inaccuracies or delays in content, or for any actions taken in reliance thereon.
For a more in-depth analysis on the relative strength of the equity markets, bonds, commodities, currencies, etc. or for more information on SIACharts.com, you can contact our sales and customer support at 1-877-668-1332 or at siateam@siacharts.com.
Copyright © SIACharts.com