by Jeffrey Saut, Chief Investment Strategist, Raymond James
We first published this in 2014, but decided to republish it today given the cover story of Barron’s that reads “The Machine Driven Market,” which intuitively means the era of those machine driven models is nigh. I like this story.
Picture this: You’re an investor starting out in the 1940s after World War II came to an end. Your own experience and contemporary history of the stock market would have taught you that bonds were the safer and the superior asset class for the long term. Verily, Wall Street history, at the time, showed the rate of return on bonds had matched stock returns over the previous 70 years with far less volatility and risk! That is a longer track record than the Ibbotson memory bank, which every bull snorts about to prove that stocks are the best asset allocation for investors. Moreover, there was always the horrible memory of the Great Crash to humble any upstart who dared to say, “This time is different.”
No wonder this unforgettable and painfully learned experience spawned a generation which developed the accepted market model that whenever the dividend yield on stocks approached bond yields equities become risky. The savvy seers of the time built their investing models, and their Wall Street careers, on giving market advice based on that stock-dividend, bond-yield relationship. Indeed, until 1958 stocks generally continued said relationship, providing higher dividend yields than the interest rate return on bonds.
Then came 1958 and the dividend yield on the major equity indices slipped below the interest rate of bonds. The pundits of the time rushed to turn cautious to bearish, warning stocks were becoming overvalued and risky. No wonder, their own shared memory, and their entire investing history, proved this to be true. After all, stocks were already risker and legally junior to bonds, providing no promise of a return of capital. So when stock yields went below bond yields – look out! It had always worked before.
But, “this time was different.” Their models didn’t seem to work. Stocks kept going higher and the gap between the current return for stocks versus bonds got larger and larger. Shocking the once savvy crowd, stocks leaped some 60% in real terms in the ten years after 1958, up through 1966. As the market went higher and higher during those eight years, some of the once expert market forecasters turned even more bearish. Now their once loyal listeners tuned them out, calling them “stopped clocks!”
“This was a new era.” Those old stopped clocks failed to recognize that modern investors appreciated the growth characteristics of stocks more than the stodgy fixed return on bonds. Moreover, the reinvestment of profits to ensure future earnings expansion was more important than the dividend return. Money managers seeking superior portfolio performance were more willing to pay up for higher growth. Then came the 1966-to-1974 double-dip bear market and most of the gains from the 1958-to-1966 bull run were given back, and more in some cases.
Now, fast forward through the 1966-to-1982 period where stocks virtually went nowhere and topped out every time the D-J Industrial Average had a peek-a-boo “look” above 1000. During that range-bound period another group of “seers” developed yet another set of time-honored valuation models based on historical Dow-S&P 500 yields, book values, and PE ratios. Their models had been back-tested and continued to prove accurate until late 1982, like those venerable models that had worked prior to 1958.
Subsequently, the August of 1982 bull market began its run above 1000 with the senior index leaping to 2722 by August 1987. It went on to overcome the October 1987 crash, the bank/real estate debacle, the Iraq-Kuwait episode in 1990, and by the spring of 1998, it had run up to over 9200. As the stock market went higher and higher during those years, some of the 1966 – 1982 second generation pundits saw their models flash warning after warning. But anyone who got out of stocks on the basis of such valuation measures was left behind and lost out on a lot of profits. Those who stubbornly stuck with those valuation metrics, in most cases, turned even more bearish and were told to change their tune or else!
Then came the Dow Theory “Sell signal” of September 23, 1999 and the stock market went into yet another trading range similar to the 1966-to-1982 affair. Hereto, models were built to try and navigate the range-bound market. Some of them worked, but many did not, as indexing outperformed the active investing crowd. At the March 2009 “lows” those same models were forecasting much lower lows and we were bullish. The S&P 500 (SPX/2425.81) broke out of its trading range in April 2013 amid cries that valuations were too rich and the rest, as they say, is history.
We dredged up this “Picture This” history lesson, which we scribed and published years ago, because we keep hearing about valuations being too rich, this is the second longest bull market in history, the economy stinks, there is a stock market crash coming, the Hindenburg Omen, etc. Ladies and gentlemen, there is an old stock market axiom that states, “If you don’t change your indicators to adjust for the changing causal relationships, you are doomed to fail!” In past missives we have expressed the view that there are more high growth/high margin companies in the SPX that ever before, and that the tectonic shift by companies from tangible assets to intangible assets on their balance sheets, by definition suggests PE ratios should be higher than their historic norms. Moreover, to reiterate, if you take out the aberrationally low PEs of the 1970s/1980s that were driven by double-digit inflation/interest rates, and tally the average PE from the beginning of each year starting with 1990 through January of 2017, the average PE for the SPX has been 23.85. Then too, we are not so sure pundits should be measuring the start of the secular bull market from the “nominal low” of March 2009. To be sure, nobody measured the 1982 – 2000 secular bull market from the “nominal low” of December 1974, but rather from when the market broke out above the 1966 – 1982 trading range in late 1982. That implies the right starting point for this secular bull might just be April 2013.
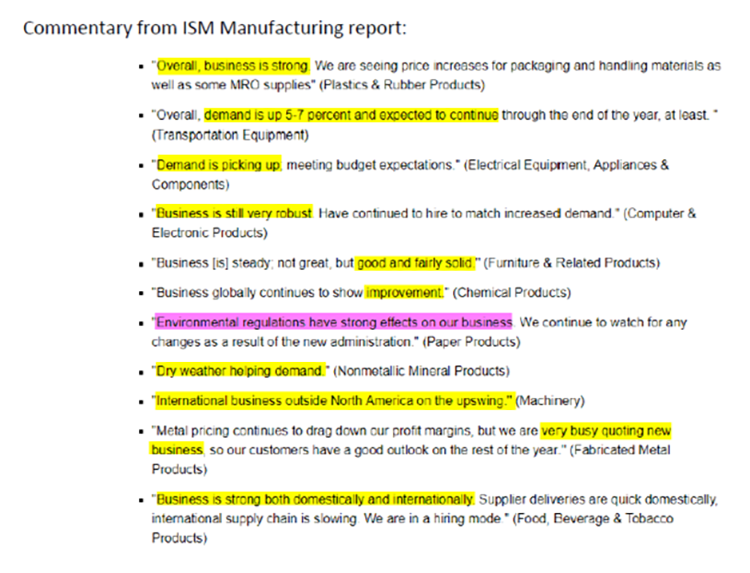
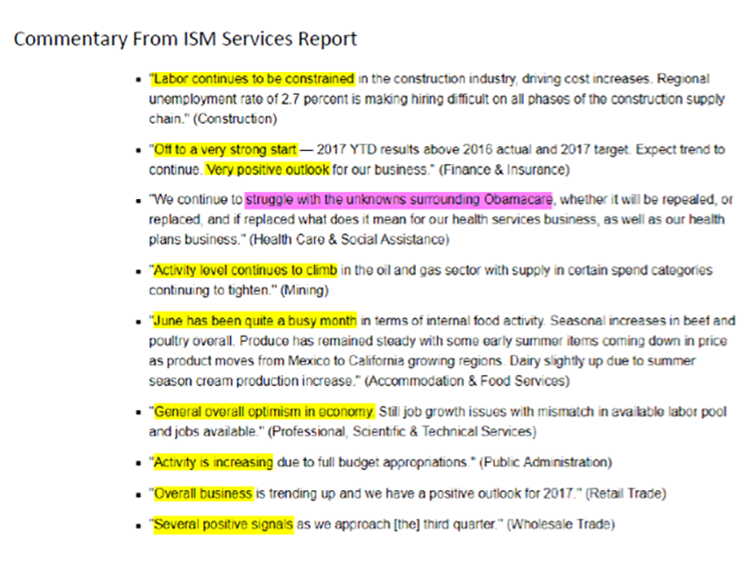
The call for this week: One of the first quantitative money managers was Dean Lebaron, the co-founder of the legendary Batterymarch. But, Dean adjusted his models for the changing causal relationships. For example, in the early 1980s he “told” his model driven computers to switch their focus from hard assets (commodities, etc.) to financial assets just as financial assets were about soar. Similarly, we tend to adjust our models for the appropriate changing causal relationships. Our long-term model flipped positive in October 2008 and has never turned negative since then. Obviously, our intermediate and short-term models flip more often. Right now the short-term model is looking for some weakness early this week, which should be bought. Categorically, we remain constructive given strong inflows, an anticipated uptick in industrial production in the back half of this year, earnings that continue to come in better than expected, and a weaker U.S. dollar, all of which should lift GDP growth in the months ahead. This view seems to be reflected in the most recent ISM reports (page 3). On a valuation basis, we tend to favor SMID over large caps and in the short-term value over growth since growth looks to be somewhat overheated.
Highlighted Excerpts From Bespoke Investment Group
Copyright © Raymond James