by Russ Koesterich, Portfolio Manager, Blackrock
Russ discusses why many technology stocks have tumbled recently, without any obvious reason.
On the surface things appear calm. The S&P 500 remains within 1% of its all-time high and volatility is still barely half the long-term average. However, under the surface things may be starting to churn.
Since last Friday tech stocks have been sold hard, with few obvious catalysts. For example, at the lows on Monday Netflix (NFLX) was down over 10% and Apple (AAPL) off 8%. What is going on?
1. An abrupt reversal of this year’s momentum trade.
In a throwback to the late 1990s, tech has once again become a momentum play. The reversal in tech is part of a broader reversal in momentum stocks, a style in which tech features prominently. Using the MSCI USA Momentum Index as a reference point, it is instructive that Microsoft (MSFT) is the biggest name, with a 5% weight. At the industry level, semiconductors, software and computers represent three of the top four industries.
2. Multiples are much higher.
Bulls can rightly point out that tech valuations pale in comparison to the surreal levels of the late ’90s. Still, multiples have been rising fast. The trailing price-to-earnings (P/E) for the S&P 500 tech sector is up over 35% from last year’s low. At nearly 25x trailing earnings, the sector is the most expensive it has been since the aftermath of the financial crisis, when earnings were depressed. On a price-to-book (P/B) basis, valuations are even more extended. Large cap U.S. technology companies are trading at the highest level since late 2007.
3. The surge in growth has made the entire style expensive.
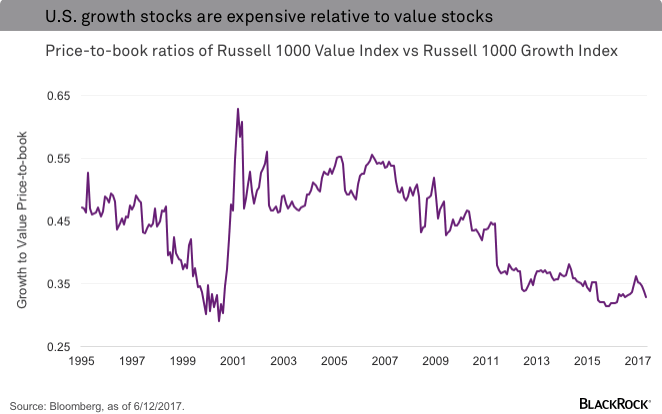
The surge and recent drop in technology needs to be viewed through a prism, which is: As investors have reconsidered the “Trump trade,” they have reverted to two investment themes–yield and growth. This has left U.S. growth stocks very expensive compared to value stocks. While tech valuations may not be in bubble territory, the ratio of value to growth multiples is starting to bear an eerie resemblance to the late 1990s. As of the end of May, the ratio—based on P/B—was just below 0.33. This is roughly 1.5 standard deviations below average and close to the all-time low of 0.31 reached in February of 2000, right before the tech bubble burst. See the chart below.
In some ways, the recent selloff resembles the “quant crash” of 2007. Similar to today, levered funds were seeking to juice returns in a low volatility world while crowding into momentum names. Whether the current disruption is eventually viewed as the first crack in the edifice, as was the case in ’07, or just a temporarily blip in a long-running bull market, remains to be seen. What is clear is that the narrow pursuit of a few story stocks has left the market more fragile than top-line indicators would suggest.
Russ Koesterich, CFA, is Portfolio Manager forBlackRock’s Global Allocation team and is a regular contributor toThe Blog.
Copyright © Blackrock


