
MAY 2017 Business Cycle Update
Five Factors Driving Crosswinds for U.S. Earnings Outlook
Profit growth returns to positive territory; foreign companies narrow gap with U.S.
Dirk Hofschire, CFA | Senior Vice President, Asset Allocation Research
Lisa Emsbo-Mattingly | Director of Asset Allocation Research
Joshua Wilde, CFA | Research Analyst, Asset Allocation Research
Austin Litvak | Senior Analyst, Asset Allocation Research
Key Takeaways
• U.S. corporate profit growth is likely to enjoy a bounce during the rest of 2017, but a mix of cyclical dynamics suggests moderating growth over the next 12–18 months.
• A tightening labor market and monetary policy indicate a solid U.S. expansion, but they also constrain the upside for profit growth.
• Renewed cyclical growth overseas—combined with the maturing U.S. business cycle back.drop—suggests the gap in economic perfor.mance between the U.S. and the rest of the world that persisted during the past several years has now disappeared.
• Improved profit conditions and relatively attrac.tive valuations have made international equities more attractive relative to U.S. stocks.
• The synchronized global expansion provides a solid backdrop for riskier assets, but smaller asset allocation tilts are warranted due to the more mature phase of the business cycle.
The U.S. business sector remains steady, and profitability has recovered from the global-trade-induced earnings recession that lasted from mid-2015 through mid-2016. With fewer headwinds from weak crude oil prices and the stronger U.S. dollar, corporate earnings grew at a positive rate at the end of 2016, a trend that is likely to persist throughout the rest of 2017. Moreover, following the November election, business sentiment and investor optimism surged in anticipation that the new administration would target pro-business policies that might boost corporate profitability.
U.S. earnings outlook: Five factors to watch
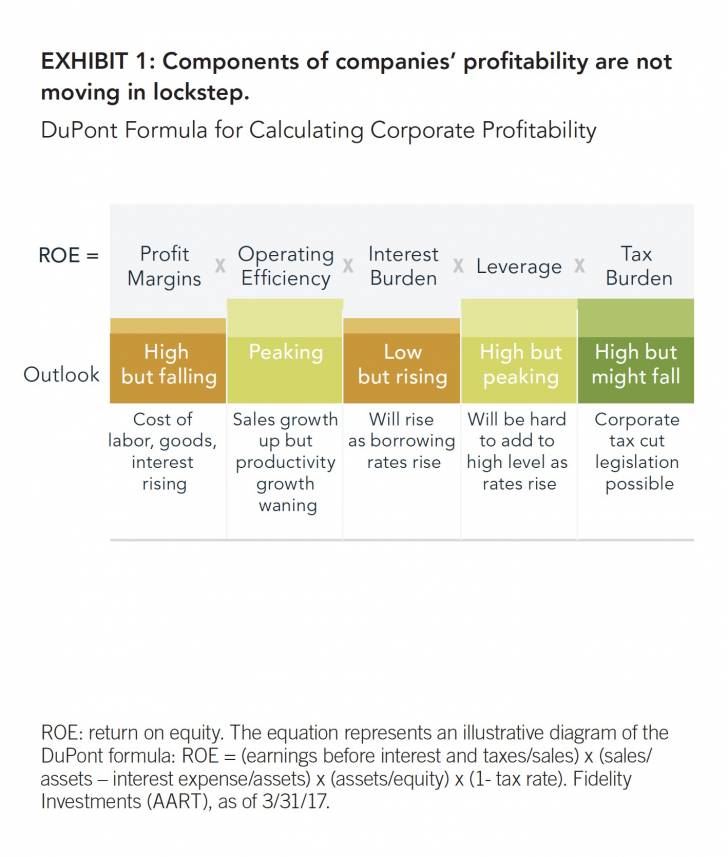
Once the near-term bounce in earnings subsides, however, a mix of cyclical dynamics in the U.S. is likely to generate increasing challenges for corporate profit growth. One way to illustrate what these challenges look like is to use a financial formula for calculating corporate profitability for shareholders, known as the DuPont analysis for return on equity (ROE).1 DuPont analysis breaks down the sources of ROE into five components: profit margins, operating efficiency, interest burden, leverage, and tax burden (see Exhibit 1).
DuPont analysis suggests that companies can raise profitability for equity shareholders through various combinations of the following five actions: increasing profit margins, improving productivity, reducing interest costs, increasing debt, and/or reducing taxes paid. This update will break down how the business cycle is influencing these different components and how they collectively point to a more moderate earnings growth trend over the next 12–18 months.
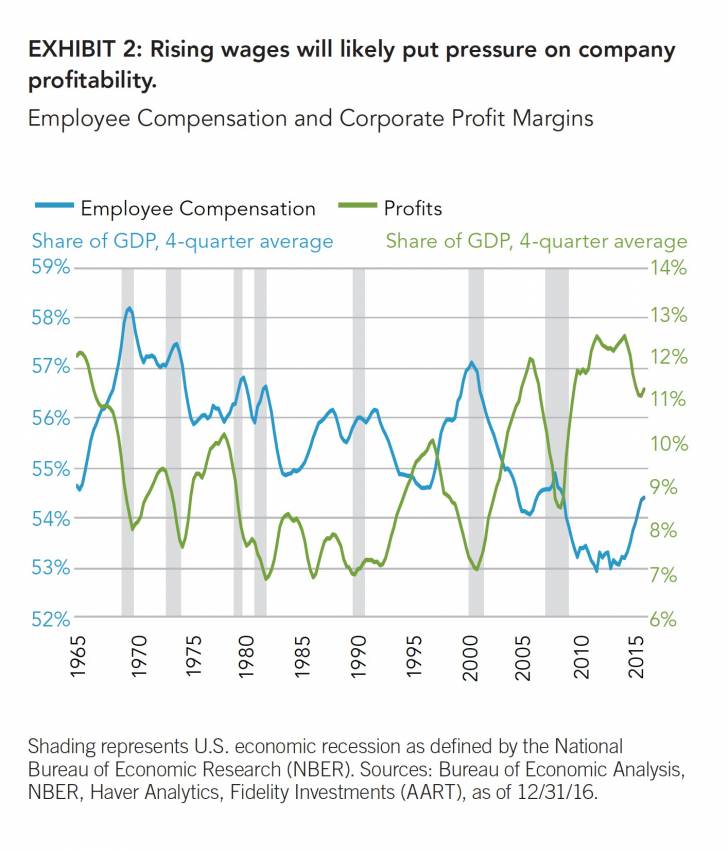
1. Rising wages chip away at record profit margins
One way for corporations to boost ROE is through higher profit margins—earnings as a share of sales. The past several decades of rising globalization have provided corporations with access to cheaper sources of labor, reducing worker compensation while bringing profit margins to record highs. In addition, the extreme level of unemployment seen during the last recession significantly depressed labor costs, further boosting margins during this cycle (see Exhibit 2). Both dynamics have pushed profit margins to record-high levels during the past several years, but today both dynamics are starting to change. Secularly, globalization may be peaking (see “Rates and Inflation—A Secular Shift?” Fidelity Q1 2017 Quarterly Market Update), and from a cyclical perspective, labor markets have now tightened to the point that they are beginning to generate more meaningful wage pressures for corporations. As a result, profit margins have started to come under pressure, and companies may have difficulty expanding profit margins from such elevated levels.
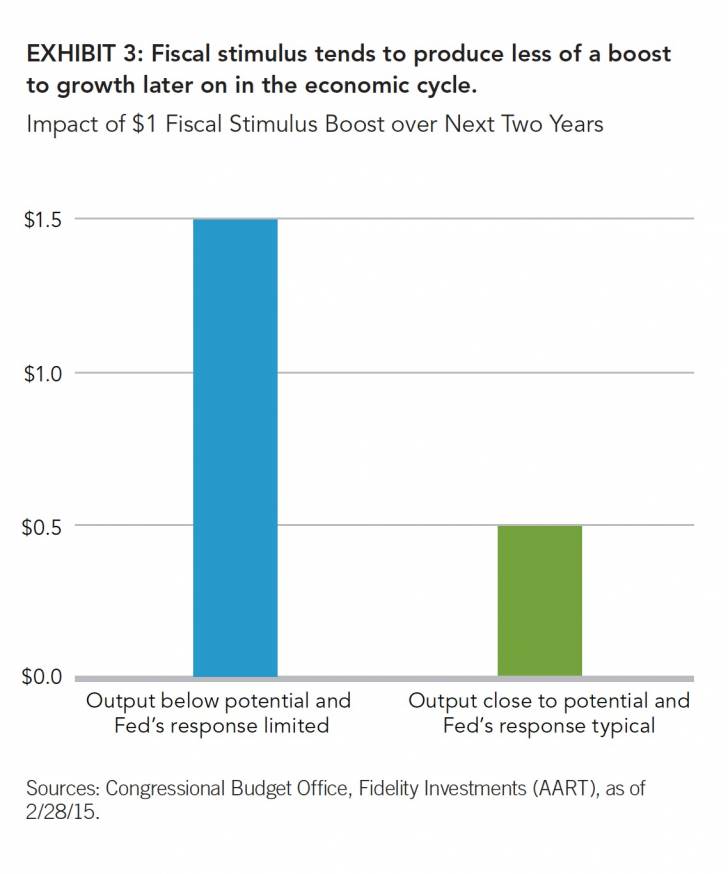
2. Cyclical boost to operating efficiency (productivity) is harder after underinvestment
Operating efficiency—sales as a proportion of assets— can be increased by growing top-line sales or improving asset productivity. Top-line sales growth has recovered along with the stabilizing global economic backdrop, and potential fiscal stimulus could further boost U.S. growth cyclically (see “What It Would Take for U.S. Economy to Grow at 4% Rate,” March 2017 Business Cycle Update). However, historically the benefits of such fiscal stimulus have been relatively limited when the economy is close to full employment and the Fed is tightening monetary policy—as is the case in the U.S. today (see Exhibit 3).
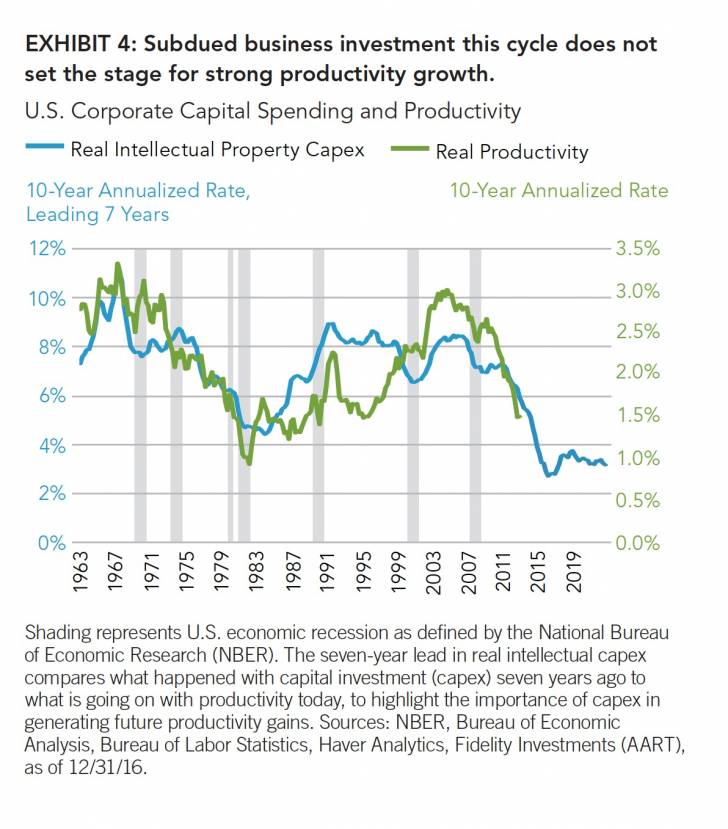
Additionally, stronger productivity growth historically has tended to follow periods of higher capital expenditures. Over the shorter term, corporations can invest toward projects that improve productivity, but it can take years for many investments to produce benefits (see Exhibit 4). Therefore, the lack of capital expenditures during this business cycle does not set the stage for more robust productivity growth. From a secular standpoint, productivity growth is further restrained due to the fact that the U.S. is a mature economy with aging demographics.
3. Rising rates may raise interest burdens
Interest burden, or interest expense as a share of earnings, is a cost to businesses that influences a company’s overall profitability. Interest expense has been near historical lows for much of this cycle due to the low interest rate environment (see Exhibit 5). With the Federal Reserve having grown more confident in the inflation backdrop and the need for more regular rate hikes, debt financing has already become more expensive. We expect companies’ interest burdens to continue to rise from these low levels, which will hinder profitability.
4. Rising rates may also limit leverage
Companies can also increase profitability by taking on more leverage. Since the 2008 recession, corporate debt outstanding has surged amid record-low interest rates (see Exhibit 5). Companies have used some of the proceeds of this debt issuance to buy back shares of their own stock—which directly boosts earnings per share as it decreases the number of shares outstanding— and, to a lesser extent, reinvest in their businesses. However, with the Fed’s monetary tightening cycle under way, credit growth is likely to slow, providing less potential for companies to use debt financing to boost earnings.
5. Tax burdens are high, but might fall
Taxes can have a meaningful impact on a company’s profitability, and they are perhaps the one component that has the potential to substantially raise earnings growth over the course of the next year. The new administration’s stated priority of cutting corporate tax rates would be an overt positive for corporate profitability by reducing the tax burden. This would particularly benefit domestically oriented companies that earn most of their profits in the U.S., where corporate tax rates are higher than in many foreign countries.
U.S. earnings summary:
• The U.S. is set to experience a 2017 boost in corporate profitability due in part to improvement in the energy sector and the global economy.
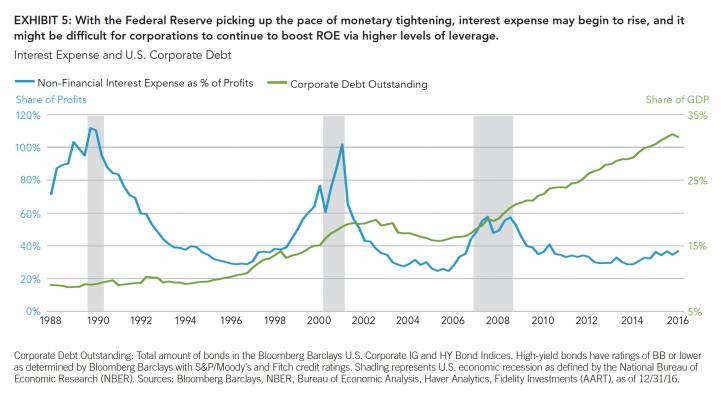
Corporate Debt Outstanding: Total amount of bonds in the Bloomberg Barclays U.S. Corporate IG and HY Bond Indices. High-yield bonds have ratings of BB or lower as determined by Bloomberg Barclays with S&P/Moody’s and Fitch credit ratings. Shading represents U.S. economic recession as defined by the National Bureau of Economic Research (NBER). Sources: Bloomberg Barclays, NBER, Bureau of Economic Analysis, Haver Analytics, Fidelity Investments (AART), as of 12/31/16.
• The 12-to-18-month outlook is more uncertain, and economic growth is likely to be constrained by more mature cyclical dynamics.
• Although none of the earnings components are flashing near-term red, the majority of them are facing increasing cyclical (and, in some cases, secular) headwinds.
• The most positive earnings story may derive from changing tax policy.
International earnings growth: Gap with U.S. closes
The global economy is experiencing a relatively steady, synchronized, global expansion, with low odds of imminent recession in most major economies (see Exhibit 6). Broadly speaking, most developed economies are in more mature (mid to late) stages of the business cycle. Germany, France, and Italy have continued to experience improving business and consumer confidence, and credit access, despite looming election uncertainty. Japan is experiencing a similar improvement in business conditions, as global demand for goods has improved. The U.K., Canada, and Australia also remain in economic expansion, although their housing markets have shown recent signs of deterioration.
At the same time, emerging-market economies have been boosted by the improved cyclical trajectory of China, which catalyzed the recovery in the global
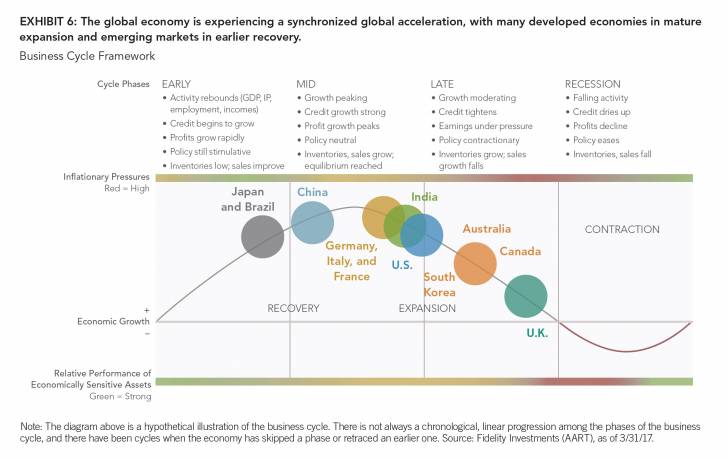
During the past 12 months earnings growth in emerging markets has actually outpaced earnings growth in the U.S. That said, although the growth gap has largely closed, the absolute magnitude of that earnings growth remains subdued—highlighting the generally mature nature of the global business cycle.
International summary:
• International equities have become relatively more attractive after several years of underperforming U.S. stocks.
• Improved cyclical dynamics have closed the gap between international and U.S. economic and profit growth.
• Price-to-earnings ratios for both developed and emerging-market equities remain attractive relative to those in the United States.
• The U.S. dollar remains historically stretched as well, with the current valuation of the broad trade-weighted dollar residing at roughly the 80th percentile versus its history since 2000.2 Any dollar weakening would further boost the returns of international equities for U.S..based investors.
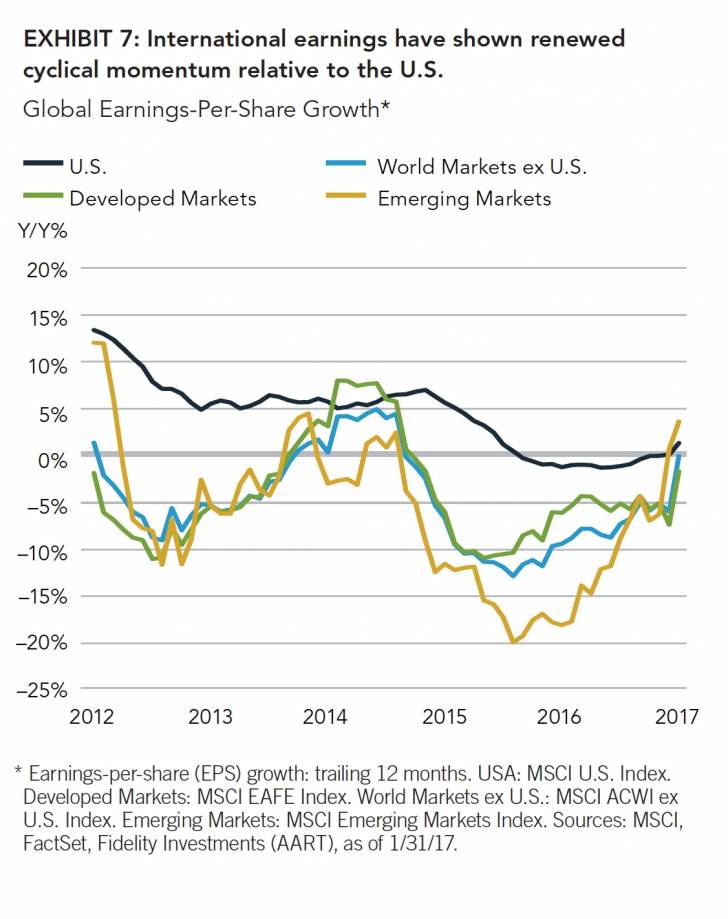
* Earnings-per-share (EPS) growth: trailing 12 months. USA: MSCI U.S. Index. Developed Markets: MSCI EAFE Index. World Markets ex U.S.: MSCI ACWI ex U.S. Index. Emerging Markets: MSCI Emerging Markets Index. Sources: MSCI, FactSet, Fidelity Investments (AART), as of 1/31/17.
Outlook
The synchronized global expansion has catalyzed a recovery in corporate profit growth and provided a solid backdrop for riskier assets. The cyclical economic and earnings growth differentials are closing between the U.S. and the rest of the world. With less good news priced into the valuations of non-U.S. equities and currencies, the fundamentals for international equities look relatively attractive.
As the U.S. business cycle continues to mature, the upside in profit growth is likely to become more constrained. With many asset categories at full valuations and political uncertainty around potential policy outcomes at elevated levels, market volatility is susceptible to moving higher. Additionally, as the U.S. proceeds toward the late-cycle phase, exposure to inflation-resistant assets may become even more valuable to provide portfolio diversification. The combination of these factors warrants smaller asset allocation tilts at this point in the cycle.
Authors
Dirk Hofschire, CFA | Senior Vice President, Asset Allocation Research Lisa Emsbo-Mattingly | Director of Asset Allocation Research Joshua Wilde, CFA | Research Analyst, Asset Allocation Research Austin Litvak | Senior Analyst, Asset Allocation Research
The Asset Allocation Research Team (AART) conducts econom.ic, fundamental, and quantitative research to develop asset allocation recommendations for Fidelity’s portfolio managers and investment teams. AART is responsible for analyzing and synthesizing investment perspectives across Fidelity’s asset management unit to generate insights on macroeconomic and financial market trends and their implications for asset allocation.
Asset Allocation Research Team (AART) Senior Research Analyst Irina Tytell, PhD; Senior Analyst Jacob Weinstein, CFA; Research Analyst Jordan Alexiev, CFA; and Analyst Cait Dourney also contributed to this article. Fidelity Thought Leadership Vice President Kevin Lavelle provided editorial direction.
*****
For Canadian investors
For Canadian prospects and/or Canadian institutional investors only. Offered in each province of Canada by Fidelity Investments Canada ULC in accordance with applicable securities laws. Endnotes
1 The equation represents an illustrative diagram of the DuPont formula: ROE = (earnings before interest and taxes/sales) x (sales/assets – interest expense/assets) x (assets/equity) x (1 - tax rate).
2 Sources: Federal Reserve Board, Haver Analytics, Fidelity Investments (AART), as of 4/21/17.
Unless otherwise disclosed to you, any investment or management recommendation in this document is not meant to be impartial investment advice or advice in a fiduciary capacity, is intended to be educational and is not tailored to the investment needs of any specific individual. Fidelity and its representatives may have a financial interest in any investment alternatives or transactions described in this document. Fidelity receives compensation from Fidelity funds and products, certain third-party funds and products, and certain investment services. The compensation that is received, either directly or indirectly, by Fidelity may vary based on such funds, products and services, which can create a conflict of interest for Fidelity and its representatives. Fiduciaries are solely responsible for exercising independent judgment in evaluating any transaction(s) and are assumed to be capable of evaluating investment risks independently, both in general and with regard to particular transactions and investment strategies.
Information presented herein is for discussion and illustrative purposes only and is not a recommendation or an offer or solicitation to buy or sell any securities. Views expressed are as of the date indicated, based on the information available at that time, and may change based on market or other conditions. Unless otherwise noted, the opinions provided are those of the authors and not necessarily those of Fidelity Investments or its affiliates. Fidelity does not assume any duty to update any of the information.
Investment decisions should be based on an individual’s own goals, time horizon, and tolerance for risk. Nothing in this content should be considered to be legal or tax advice, and you are encouraged to consult your own lawyer, accountant, or other advisor before making any financial decision.
Fixed-income securities carry inflation, credit, and default risks for both issuers and counterparties.
Although bonds generally present less short-term risk and volatility than stocks, bonds do contain interest rate risk (as interest rates rise, bond prices usually fall, and vice versa) and the risk of default, or the risk that an issuer will be unable to make income or principal payments. Additionally, bonds and short-term investments entail greater inflation risk—or the risk that the return of an investment will not keep up with increases in the prices of goods and services—than stocks. Increases in real interest rates can cause the price of inflation-protected debt securities to decrease. Stock markets, especially non-U.S. markets, are volatile and can decline significantly in response to adverse issuer, political, regulatory, market, or economic developments. Foreign securities are subject to interest rate, currency exchange rate, economic, and political risks, all of which are magnified in emerging markets. Investing involves risk, including risk of loss. Past performance is no guarantee of future results. Diversification and asset allocation do not ensure a profit or guarantee against loss.
All indices are unmanaged. You cannot invest directly in an index.
Increases in real interest rates can cause the price of inflation-protected debt securities to decrease. The commodities industries can be significantly affected by commodity prices, world events, import controls, worldwide competition, government regulations, and economic conditions. The Business Cycle Framework depicts the general pattern of economic cycles throughout history, though each cycle is different; specific commentary on the current stage is provided in the main body of the text. In general, the typical business cycle demonstrates the following: During the typical early-cycle phase, the economy bottoms out and picks up steam until it exits recession then begins the recovery as activity accelerates. Inflationary pressures are typically low, monetary policy is accommodative, and the yield curve is steep. Economically sensitive asset classes such as stocks tend to experience their best performance of the cycle. During the typical mid-cycle phase, the economy exits recovery and enters into expansion, characterized by broader and more self-sustaining economic momentum but a more moderate pace of growth. Inflationary pressures typically begin to rise, monetary policy becomes tighter, and the yield curve experiences some flattening. Economically sensitive asset classes tend to continue benefiting from a growing economy, but their relative advantage narrows. During the typical late-cycle phase, the economic expansion matures, inflationary pressures continue to rise, and the yield curve may eventually become flat or inverted. Eventually, the economy contracts and enters recession, with monetary policy shifting from tightening to easing. Less economically sensitive asset categories tend to hold up better, particularly right before and upon entering recession. GDP: gross domestic product. Index definitions
The MSCI All Country World ex USA Index is a market capitalization-weighted index designed to measure the equity market performance of developed markets, excluding the U.S. The MSCI Emerging Markets (EM) Index is a market capitalization-weighted index that is designed to measure the investable equity market performance for global investors in emerging markets. The MSCI Europe, Australasia, Far East (EAFE) Index is a market capitalization-weighted index that is designed to measure the investable equity market performance for global investors in developed markets, excluding the U.S. and Canada. The MSCI U.S.A. Index is a market capitalization-weighted index designed to measure the equity market performance of markets in the United States. Third-party marks are the property of their respective owners; all other marks are the property of Fidelity Investments Canada ULC. If receiving this piece through your relationship with Fidelity Institutional Asset Management® (FIAM), this publication may be provided by Fidelity Investments Institutional Services Company, Inc., Fidelity Institutional Asset Management Trust Company, or FIAM LLC, depending on your relationship. If receiving this piece through your relationship with Fidelity Personal & Workplace Investing (PWI) or Fidelity Family Office Services (FFOS), this publication is provided through Fidelity Brokerage Services LLC, Member NYSE, SIPC. If receiving this piece through your relationship with Fidelity Clearing & Custody SolutionsSM or Fidelity Capital Markets, this publication is for institutional investor or investment professional use only. Clearing, custody, or other brokerage services are provided through National Financial Services LLC or Fidelity Brokerage Services LLC, Member NYSE, SIPC. © 2017 Fidelity Investments Canada ULC. All rights reserved. US: 800388.1.0 CAN: 801219.1.0