by Dr. Brian Jacobsen, CFA, Wells Fargo Asset Management
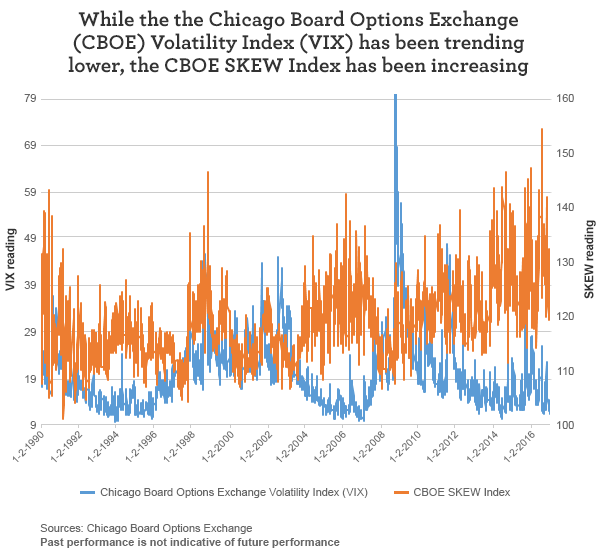
Volatility can return with a vengeance. Calm can turn to chaos on the turn of a dime. Lately, people were wondering whether markets were too complacent. And if investors looked only at The Chicago Board Options Exchange Volatility Index—otherwise known as the “VIX”—it would have been too easy to think that. However, the markets had been bracing for a relatively large move down, if you looked at the Chicago Board Options Exchange (CBOE) SKEW Index (SKEW), which is supposed to reflect investors’ expectations of large declines in the equity markets.
Despite today’s downdraft, consider that the VIX is still relatively low at 14. Today’s move down in the market may have been due to profit-taking, politically-driven decisions, or something else. I think it was profit-taking with politics as an excuse.
The economic backdrop is still too strong to worry about ringing the bell on the death of the bull market run. Tax reform does not have to be delayed, due to the recent news coming out of the White House. Congress has ample capacity to deal with investigations, inquiries, or confirmations along with their existing agenda. But even if tax reform becomes impossible—which I don’t think it is—that wouldn’t likely matter much to the non-U.S. portion of a globally-diversified portfolio.
So let’s take a closer look at the VIX, which has been in the media spotlight, given its recent low readings. While the VIX has been low, credit spreads have been narrow. Many commentators are not only saying investors have been calm, but somehow because the VIX is so low, they’ve also been complacent. I take issue with that description. When looking at the markets, it’s usually best to ignore a term like complacent, because it’s loaded and assumes the conclusion the user is advocating, which is poor form in crafting an argument. Complacency means a type of smugness and obliviousness to real risks.
But the calmness in today’s market is tangible. So what does that calm reflect, and what does it foretell? Let’s start with the numbers. The VIX, an implied volatility index, hit its record low of 9.31 on 12-22-1993. It got close to breaking through that low when it got to 9.56 on 5-9-2017.
What does that number mean? The VIX is calculated from option prices to infer investors’ expectations for the annualized standard deviation of daily returns over the next month. It assumes a certain model about how investors price options, from which it derives what level of volatility would be consistent with option prices. The VIX, however, does a better job telling you about what has happened instead of what will happen. The correlation coefficient with the previous 20 days’ volatility is 0.876 while the correlation with subsequent volatility is 0.77.
Still, it’s hard to ignore that the VIX is quite low. While the VIX may be more a thermometer than a thermostat—in other words, it reflects what’s going on; it doesn’t control what will happen—it still seems puzzling that we could have not only a low VIX, but also low realized volatility with all the political uncertainty out there.
What the VIX misses is the possibility of big moves in the markets. As mentioned, the CBOE SKEW Index is supposed to reflect investors’ expectations of large equity market declines. The VIX does not capture these possible big moves.
While VIX has been trending lower, people apparently are buying up options in order to bet on big downward moves in the equity market. That’s what a higher SKEW represents.
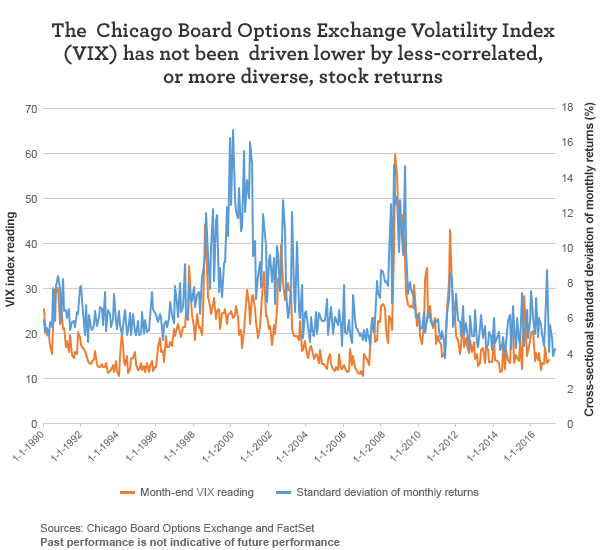
One explanation of a low VIX that seems plausible (until you look at the data) is that stocks are becoming less correlated. In principle, even if individual stocks’ volatility levels haven’t changed, if they become less tethered together, the aggregate level of volatility should fall. However, the reality is that this rarely happens. I measure the diversity of returns (more diverse means the correlations are lower) by the cross-sectional standard deviation of returns. Empirically, when the standard deviation of returns increased (when correlations declined), the VIX actually went up.
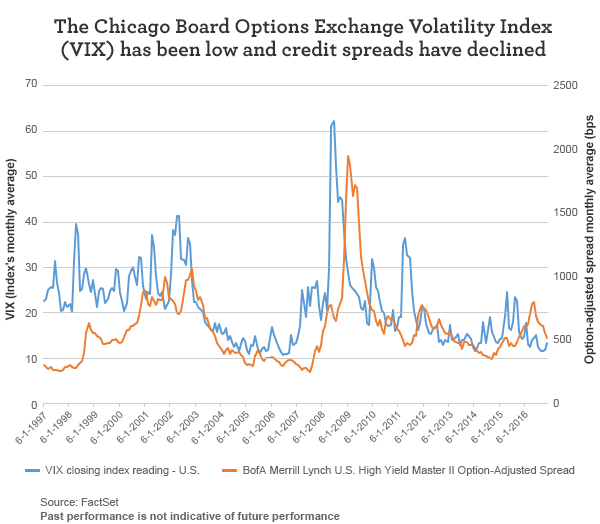
As the VIX has moved lower, so has the credit spread on high-yield bonds—and these two events could be related.
The difference in yield between high-yield bonds as represented by the BofA Merrill Lynch U.S. High Yield Master II Index and Treasury yields has been narrower—in February 2015, for all of 2004 through 2007, and from 1993 through 1998. However, spreads have come down since last year.
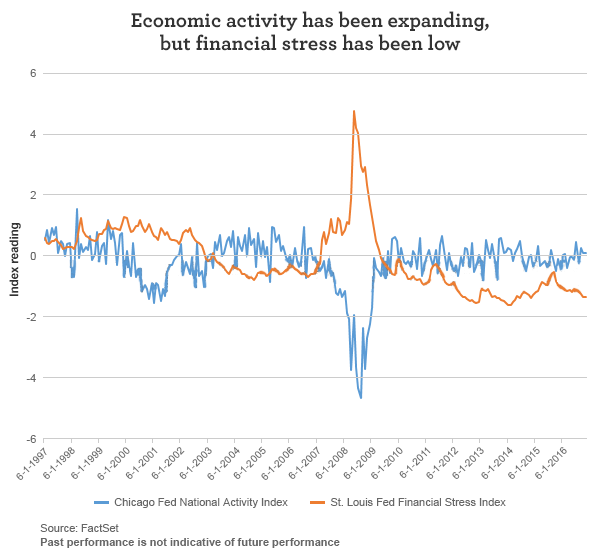
When time-series move together like this, there is likely an underlying common cause. I believe the common cause is the combination of moderate economic activity and very low financial stresses.
While many people may be scratching their heads about why the VIX has been so low, I think the answer is two-fold: First, the VIX is imperfect. Investors are actually nervous about big moves in the markets, as reflected by SKEW. Second, financial stresses are low. Easy money can suppress volatility. This is why many investors are waiting on and watching the Federal Reserve (Fed) to see how committed it is to only gradually normalizing monetary policy. An abrupt shift in the way people perceive how the Fed will progress with policy could tighten conditions abruptly. The Fed knows this, too, which is why it’s unlikely to send any hasty signals. A low VIX is simply a low VIX, nothing more.
Copyright © Wells Fargo Asset Management


