
MAY 2017
A Question of Valuation
With U.S. stock prices on the high side, keep an eye on earnings and less-expensive opportunities overseas.
by Jurrien Timmer, Director of Global Macro, @TimmerFidelity | Fidelity Investments Canada
Key Takeaways
• The price-to-earnings (P/E) ratio for the S&P 500® Index has jumped more than two points since the November 2016 U.S. election, driven by expectations of improved earnings growth.
• The P/E increase has occurred despite a rise in bond yields, which normally acts as a valuation headwind for stocks.
• U.S. earnings are growing again, but valua.tions have already priced this in, suggesting that U.S. stock prices could lag behind earn.ings growth as the market waits for earnings to come through before any lift in the multiple.
• Less-expensive opportunities for growth may be found in stock markets outside the U.S.
U.S. stocks moving sideways
Prior to April 24–25, the U.S. stock market had moved sideways in recent weeks, with the large-cap S&P 500 Index down 2% to 3% from its February highs and the small-cap Russell 2000® Index stuck in a sideways pattern since mid-December. I see two reasons for this.
First, the U.S. economy has reached peak reflation, meaning it’s still growing, but at a slower pace (see April commentary “Peak Reflation May Be Looming”). As evidence, global PMIs1 declined last month. After peaking in February, U.S. manufacturing growth slowed to a six-month low in March, and new orders came in at the slowest pace since October.2 History shows that when economic momentum peaks, the stock market tends to be choppy for a while. That doesn’t necessarily mean a correction or bear market, just a stalling out.
The second reason why stocks may be moving sideways is the uncertainty surrounding potential fiscal policy. It’s still unclear if, when, or how fiscal stimulus will be implemented, and we also don’t know what the impact will be on GDP for every dollar spent on fiscal stimulus.
If the stimulus is on the demand side (e.g., infrastructure spending), it could potentially be offset by more- aggressive interest-rate hikes by the Federal Reserve (Fed), which would reduce the GDP benefits while leaving interest rates higher. Not exactly a win-win strategy.
After eight years of economic expansion and with employment relatively full, any demand-side fiscal shock could be inflationary. But if stimulus is on the supply side (e.g., a permanent reduction in taxes and regulation), GDP growth could rise and keep the Fed at bay. GDP growth equals labor force growth plus productivity growth. The labor force is not growing much, so higher GDP will have to come from higher productivity.
Market positive: corporate earnings
With fiscal policy changes likely delayed until later this year, and with the economic growth rate slowing, it’s no surprise the market has stalled a bit. The good news is that corporate earnings are on the rise. The earnings season is in full swing and the expected year-over-year growth rate for Q1 is 9.7%.3 With the usual seasonal drift, Q1 earnings growth could be in the double digits.
That’s a far cry from Q1 2016, when earnings were falling 7% year over year. Granted, comparisons to last year’s trough earnings are easy, but the improvement is real.
Market concern: valuations
If there is a concern with U.S. stocks, it may be valuations. The S&P 500’s trailing P/E ratio is up two points since the November election (18.5x to 20.8x) on expectations that earnings would accelerate in 2017 and beyond. In my view, the market was correct in expecting this. But valuations are now on the high side and should come down. However, this could offset some of the price gains that would normally occur when earnings are growing.
According to the discounted cash flow model, valuation is influenced by changes in expected earnings growth and in the discount rate. The discount rate consists of the “risk-free rate” (e.g., 10-year Treasury yield) plus the equity risk premium, or ERP (the excess return the stock market provides over the risk-free rate). Combined, they form the rate at which the expected earnings are “discounted” to arrive at a net present value. This is then compared to the current price to determine whether the market is rich or cheap.
Following the 2016 election, the 10-year Treasury yield rose from 1.7% to 2.6%. Normally, this would have created a headwind for valuations because higher yields typically lead to a higher discount rate and a lower present value of future earnings. In this case, though, the market rallied so much that the ERP collapsed to 2.3%, more than offsetting the rise in the risk-free rate. As a result, the current ERP is well below its historical 3.5%–4.0% range, which could leave the stock market vulnerable if earnings don’t materialize or if there is an external market shock of some kind.
If the ERP resets to historical norms and the 10-year yield stays close to its current level (2.25% as of April 24),4 then the discount rate could rise from its current level of 4.8% to 6.0%. If earnings growth weakens against that backdrop, the market’s P/E ratio would be about four points too high (16.9x vs 20.8x). But if earnings growth continues to materialize, then a sustained earnings growth rate of 5% and a discount rate of 6% means the market is worth 21x. That’s pretty much where we are now. The question of whether the market is fully or overvalued is important. It’s already priced in a sizable earnings gain, is now at a crossroads with regard to fiscal policy, and is also facing increased geopolitical tensions. Cheap markets are better able to withstand external shocks than expensive markets, and U.S. stocks are not cheap. At its current trailing P/E of almost 21 times earnings, I believe the U.S. market is fully priced and, therefore, a bit more vulnerable to external risks (North Korea, Syria, multiple European elections) than it otherwise would be.
But remember, there’s always something in the market to worry about. Based on S&P 500 Index data between 1928–2016, a 10% correction occurs about once every three years and the odds of a 20% bear market are about one in five. Nevertheless, the index gained about 10% on average per year during that 88-year period. For the typical investor, the key to weathering volatility is to have a solid investment plan and to stick with it.
Rebalance for growth, diversification
Part of a solid plan is to periodically rebalance one’s U.S. and non-U.S. equity allocation, and now may be a good time to consider adding international exposure. U.S. stocks have significantly outrun non-U.S. equities since 2011, but U.S. stocks are quite a bit more expensive than both international developed and emerging markets.
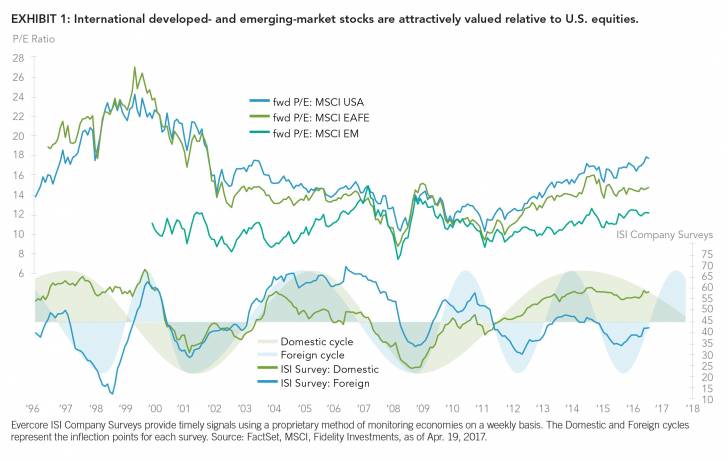
As shown in Exhibit 1, the MSCI USA Index is trading at 17.7x forward earnings, while the international developed market (MSCI EAFE) is at 14.8x and emerging-market stocks (MSCI EM) are only at 12.2x. Compare that to 2011, when all three regions traded within just a few points of each other. In terms of total returns, since the March 2009 cycle bottom through mid-April 2017, the S&P 500 has returned 282%, while international developed and emerging markets are up 136% and 130%, respectively.5 That’s a very large performance gap.
So far, this gap between performance and valuation has been justified by the relative stability and resilience of the U.S. business cycle and stronger earnings results since 2011. During that same period, Europe, Japan, and emerging markets have hit a number of economic and business headwinds. You can see this 2011–2016 divergence in the foreign/domestic cycle diagram at the bottom of Exhibit 1. Note, however, that the diagram also reveals that the cycle favored foreign stocks from 2002–2010. This reminds us that international and U.S. stock performance is cyclical: One typically outperforms the other for several years until the cycle reverses.
In my view, now that the global cycle has re-synchronized and earnings growth is inflecting higher across both the U.S. and foreign markets, it’s quite possible the performance gap between U.S. and international stocks will continue to shrink in the coming quarters.
Author
Jurrien Timmer | Director of Global Macro, Fidelity Global Asset Allocation Division
Jurrien Timmer is the director of Global Macro for the Global Asset Allocation Division of Fidelity Investments, specializing in global macro strategy and tactical asset allocation. He joined Fidelity in 1995 as a technical research analyst.
Fidelity Thought Leadership Vice President Matt Bennett provided editorial direction for this article.
*****
For Canadian investors
For Canadian prospects and/or Canadian institutional investors only. Offered in each province of Canada by Fidelity Investments Canada ULC in accordance with applicable securities laws. Endnotes
1A Purchasing Managers’ Index (PMI) is a survey of purchasing managers in a certain economic sector. A PMI over 50 represents expansion of the sector compared to the previous month, while a reading under 50 represents a contraction, and a reading of 50 indicates no change. The Institute for Supply Management® reports the U.S. manufacturing PMI®. 2 Source: The Institute for Supply Management, Markit PMI, as of Apr. 3, 2017. 3 Source: Bloomberg Finance LLP, as of Apr. 18, 2017. 4 Source: U.S. Department of the Treasury, as of Apr. 24, 2017. 5 Source: FactSet, as of Apr. 14, 2017.
Unless otherwise disclosed to you, any investment or management recommendation in this document is not meant to be impartial investment advice or advice in a fiduciary capacity, is intended to be educational and is not tailored to the investment needs of any specific individual. Fidelity and its representatives have a financial interest in any investment alternatives or transactions described in this document. Fidelity receives compensation from Fidelity funds and products, certain third-party funds and products, and certain investment services. The compensation that is received, either directly or indirectly, by Fidelity may vary based on such funds, products and services, which can create a conflict of interest for Fidelity and its representatives. Fiduciaries are solely responsible for exercising independent judgment in evaluating any transaction(s) and are assumed to be capable of evaluating investment risks independently, both in general and with regard to particular transactions and investment strategies.
Information presented herein is for discussion and illustrative purposes only and is not a recommendation or an offer or solicitation to buy or sell any securities.
Views expressed are as of the date indicated, based on the information available at that time, and may change based on market and other conditions. Unless otherwise noted, the opinions provided are those of the author and not necessarily those of Fidelity Investments or its affiliates. Fidelity does not assume any duty to update any of the information.
Investment decisions should be based on an individual’s own goals, time horizon, and tolerance for risk. Nothing in this content should be considered to be legal or tax advice and you are encouraged to consult your own lawyer, accountant, or other advisor before making any financial decision.
Stock markets, especially non-U.S. markets, are volatile and can decline significantly in response to adverse issuer, political, regulatory, market, or economic developments. Foreign securities are subject to interest rate, currency exchange rate, economic, and political risks, all of which are magnified in emerging markets.
Investing involves risk, including risk of loss.
Past performance is no guarantee of future results.
Diversification and asset allocation do not ensure a profit or guarantee against loss.
All indices are unmanaged. You cannot invest directly in an index.
Index definitions
Standard & Poor’s 500 (S&P 500®) Index is a market capitalization-weighted index of 500 common stocks chosen for market size, liquidity, and industry group representation to represent U.S. equity performance. S&P 500 is a registered service mark of The McGraw-Hill Companies, Inc., and has been licensed for use by Fidelity Distributors Corporation and its affiliates.
MSCI Europe, Australasia, Far East Index (EAFE) is a market capitalization-weighted index that is designed to measure the investable equity market performance for global investors in developed markets, excluding the U.S. & Canada.
MSCI Emerging Markets (EM) Index is a market capitalization-weighted index designed to measure the investable equity market performance for global investors in emerging markets.
Third-party marks are the property of their respective owners; all other marks are the property of Fidelity Investments Canada ULC.
If receiving this piece through your relationship with Fidelity Institutional Asset Management® (FIAM), this publication may be provided by Fidelity Investments Institutional Services Company, Inc., Fidelity Institutional Asset Management Trust Company, or FIAM LLC, depending on your relationship.
If receiving this piece through your relationship with Fidelity Personal & Workplace Investing (PWI) or Fidelity Family Office Services (FFOS), this publication is provided through Fidelity Brokerage Services LLC, Member NYSE, SIPC.
If receiving this piece through your relationship with Fidelity Clearing & Custody SolutionsSM or Fidelity Capital Markets, this publication is for institutional investor or investment professional use only. Clearing, custody or other brokerage services are provided through National Financial Services LLC or Fidelity Brokerage Services LLC, Members NYSE, SIPC.
© 2017 Fidelity Investments Canada ULC. All rights reserved. US: 797135.1.1 CAN: 800383.1.0