by Ryan Detrick, LPL Research
President Trump’s 100th day in office is right around the corner on April 29. This coincides with a potential government shutdown; so all of this, coupled with the French elections this weekend, could make the remaining weeks of April quite interesting.
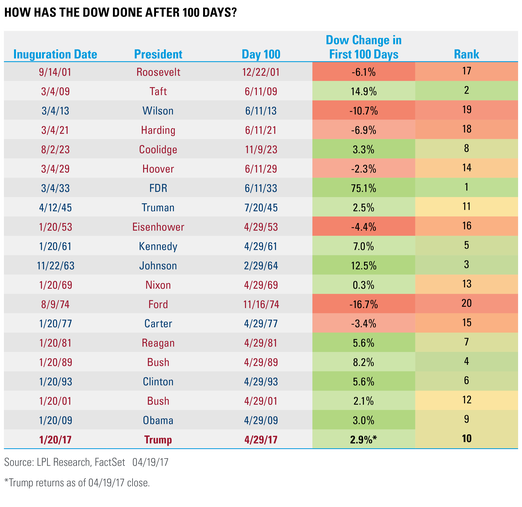
We’ve heard the question many times: Where does the Trump rally rank? That is what we will look at today. The term “hundred days” was first used on July 24, 1933, on the radio by President Franklin D. Roosevelt. He was discussing the 100-day session of the 73rd U.S. Congress, but over time this term has changed to refer to the first 100 days of a new president.
Per Ryan Detrick, Senior Market Strategist, “The Dow over the first 100 days has been higher with the past five presidents by 4.6% on average, and the Dow is currently up 2.9% since President Trump took office. With a median return of 2.7%, this would rank near the middle of the pack for all presidents going back to 1900. Most might find that surprising, but of course, much of the Trump rally took place prior to his inauguration, and those gains don’t count in this case.”
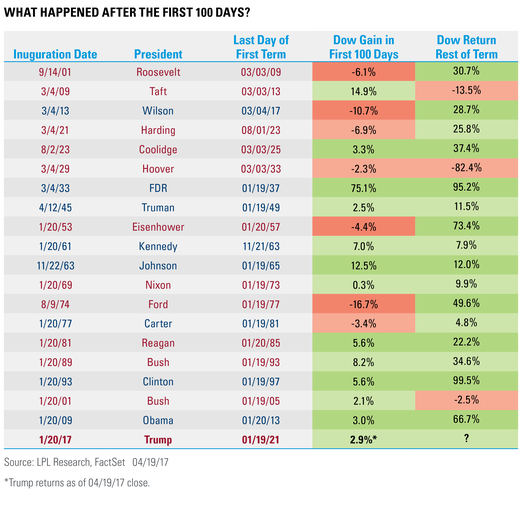
What can we glean from those first 100 days? Is there any pattern that might suggest how stocks will do during the rest of the time Trump is in office? You can look for yourself below, but there doesn’t appear to be any clue as to what might happen. President Eisenhower had a weak first 100 days, then a big rally over the remainder of his time in office. Conversely, President Taft saw a big rally during the first 100 days, only to have negative returns for the remainder of his time in office. In the end, fundamentals, valuations, and technicals drive long-term equity returns. The good news is only once since the Great Depression did that mean lower returns for the remainder of time in office after the first 100 days.
IMPORTANT DISCLOSURES
Past performance is no guarantee of future results. All indexes are unmanaged and cannot be invested into directly.
The opinions voiced in this material are for general information only and are not intended to provide or be construed as providing specific investment advice or recommendations for any individual security.
The economic forecasts set forth in the presentation may not develop as predicted.
Investing in stock includes numerous specific risks including: the fluctuation of dividend, loss of principal and potential illiquidity of the investment in a falling market.
Stock investing involves risk including loss of principal.
Dow Jones Industrial Average (DIJA) is the most widely used indicator of the overall condition of the stock market, a price-weighted average of 30 actively traded blue-chip stocks, primarily industrials. The 30 stocks are chosen by the editors of the Wall Street Journal. The Dow is computed using a price-weighted indexing system, rather than the more common market cap-weighted indexing system.
This research material has been prepared by LPL Financial LLC.
To the extent you are receiving investment advice from a separately registered independent investment advisor, please note that LPL Financial LLC is not an affiliate of and makes no representation with respect to such entity.
Not FDIC/NCUA Insured | Not Bank/Credit Union Guaranteed | May Lose Value | Not Guaranteed by any Government Agency | Not a Bank/Credit Union Deposit
Securities and Advisory services offered through LPL Financial LLC, a Registered Investment Advisor Member FINRA/SIPC
Tracking # 1-601467 (Exp. 4/18)
Copyright © LPL Research


