
Which breaks first, stock prices or uncertainty?
by Burt White, CIO, LPL Financial
KEY TAKEAWAYS
- Longer-term technical indicators on equities continue to look strong.
- Sentiment is mixed, but with uncertainty high, the potential for increased market volatility is on the rise.
Some significant technical trend lines are in play, so we take a closer look at market technicals and sentiment this week. The longer-term technicals continue to look strong, and an evaluation of global market breadth suggests the path of least resistance remains higher for stocks. However, sentiment remains a much more mixed picture indicating that market volatility could finally be heating up.
Long-Term Trendlines Support Higher Prices
It is easy to get lost in the daily news cycle, but a longer-term view can help put things in perspective. Two popular long-term trend lines used in technical analysis are the 50- and 200-day moving averages (MA). We have seen interesting developments in both indicators recently.
A 50-day moving average is the average of the previous 50 closes. Likewise, a 200-day moving average is the average of the previous 200 closes. Both are technical indicators used by trend followers.
First up, on Thursday, April 12, the S&P 500 Index closed beneath the 50-day MA for the first time in 105 days [Figure 1]. This was the longest streak above the 50-day MA since 130 days in a row nearly six years ago. Could this be a sign of coming technical weakness? Going back to 1950*, the S&P 500 was above the 50-day MA for at least 100 days 14 times, and the performance after the initial close beneath this trend line did not suggest the start of a major breakdown. In fact, three months later the S&P 500 was up 2.2% on average, slightly higher than the average three-month return of 2.1%. Six months later gains have been slightly below average (3.8% versus 4.3%), but still higher 10 out of the 13 times.
*Please note: The modern design of the S&P 500 stock index was first launched in 1957. Performance back to 1950 incorporates the performance of predecessor index, the S&P 90.
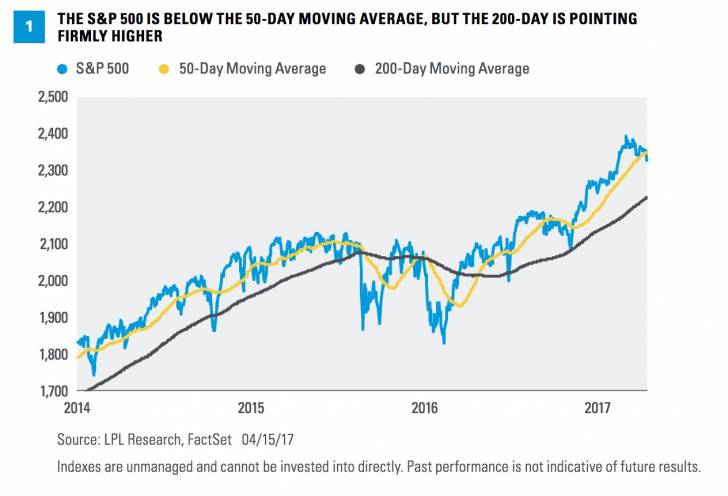
Turning to the 200-day MA, it is 4.3% below current index levels and continues to trend higher. In fact, it has closed at a new all-time high every day since last Halloween (October 2016). As you can see in Figure 1, this trend line provided nice support on the pre-U.S. election weakness and has been firmly pointing higher since rising last summer. With both the 50-day and 200-day moving averages trending higher, this is a sign that the technical backdrop remains strong and any weakness could be a buying opportunity.
An EXPANDED Look At Market Breadth
We’ve noted many times over the past year that market breadth has been strong, and this should lead to ultimately higher prices; fortunately, that has been correct. One of our favorite market breadth indicators is the NYSE Composite Advance/Decline (A/D) line, which is part of LPL Research’s Five Forecasters. Simply put, we are seeing more stocks advance than decline, a sign of a healthy market. We took a closer look at this bullish indicator in our previous Weekly Market Commentary, “How Much Is Left in the Tank?”
Market breadth is a technique that attempts to determine the direction of the overall market by analyzing the proportion of securities that are participating in the market move.
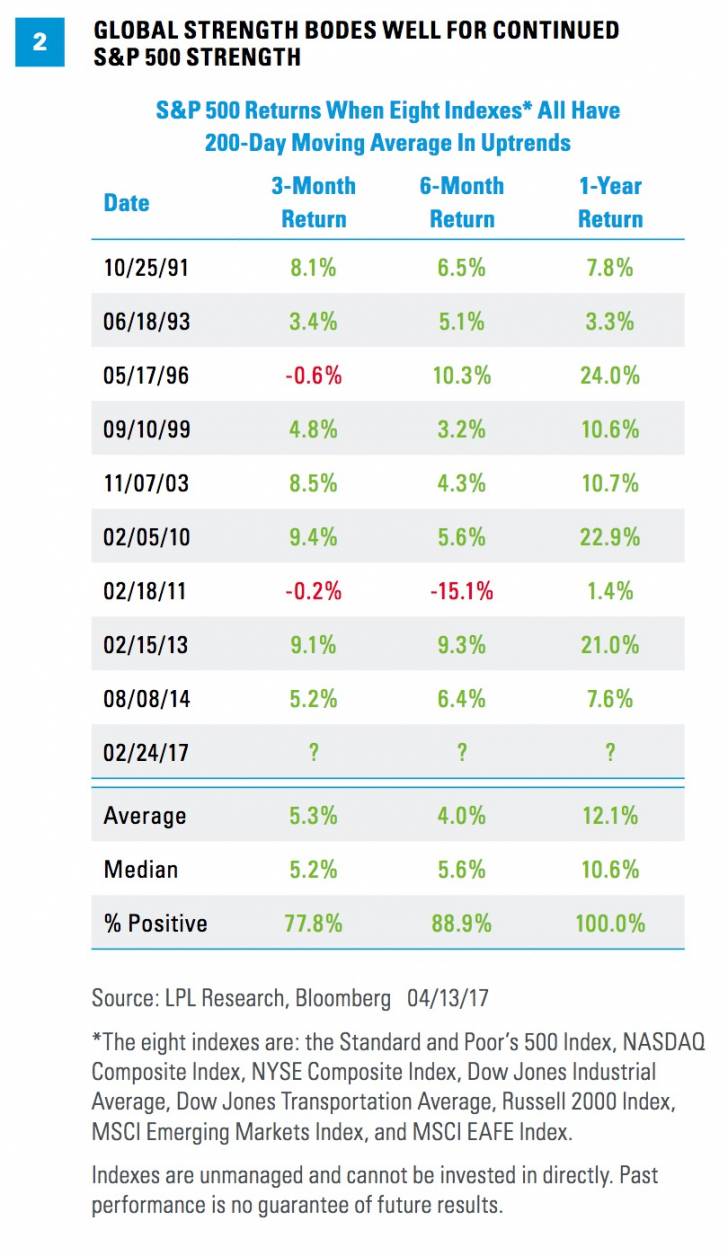
Market breadth can also show how strong global markets are, not just U.S.-based equities, as we are also currently seeing uptrends across developed markets in Europe and Asia and in emerging markets (EM). What is unique right now is the 200-day moving average is in an uptrend for these eight global indexes: the S&P 500, Nasdaq Composite, NYSE Composite, Dow Jones Industrial and Transportation Averages, Russell 2000, MSCI Emerging Markets, and MSCI EAFE. That’s a lot of underlying global strength.
The recent signal took place in late February, and Figure 2 has the returns for the S&P 500 across various time frames after all eight indexes are in uptrends. As you can see, continued equity gains are normal; a year later the S&P 500 has never been lower, with an average gain of 12.1% (based on data since 1990).
Investor sentiment
History has shown that the crowd can be right during trends, but it also tends to be wrong at extremes. This is why sentiment can be an important contrarian indicator, because if everyone who might become bearish has already sold, only buyers are left. The reverse also applies.
Sentiment polls are showing a good deal of worry even though the S&P 500 is less than 3% from all-time highs. The American Association of Individual Investors (AAII) Sentiment Survey has had more bears than bulls in each of the past three weeks for the first time since right before the U.S. election. Similarly, the National Association of Active Investment Managers (NAAIM) recently had the lowest exposure to equities since right before the election. Last, according to EPFR Global fund data, nearly $15 billion was pulled out of U.S. equity mutual fund and exchanged-traded fund (ETF) during the first week of April, the largest outflows for any one week during the past year.
It isn’t all skepticism though, as the Conference Board’s Consumer Confidence Survey shows confidence is at the highest level since December 2000. Also, the NFIB Small Business Optimism Index continues to retain almost all of its large post-election gains.
Sentiment has something for everyone, but to sum it up, we would say the overall backdrop is mixed.
Time For Volatility?
The CBOE Volatility Index (VIX), often referred to as the “fear gauge,” closed above 15 for the first time since early November 2016. It had closed beneath this level 104 consecutive days, the longest streak in 10 years. Is volatility finally coming back after taking a few months off? It could be…
Remember, last month saw the end to 109 days in a row without a 1% drop for the S&P 500, the longest streak in nearly 22 years. Also, before the late sell-off last week, the S&P 500 had gone 10 consecutive days with each close between up or down 0.35% for the first time since December 1968. Volatility doesn’t stay dormant forever, and it very well could make a comeback soon.
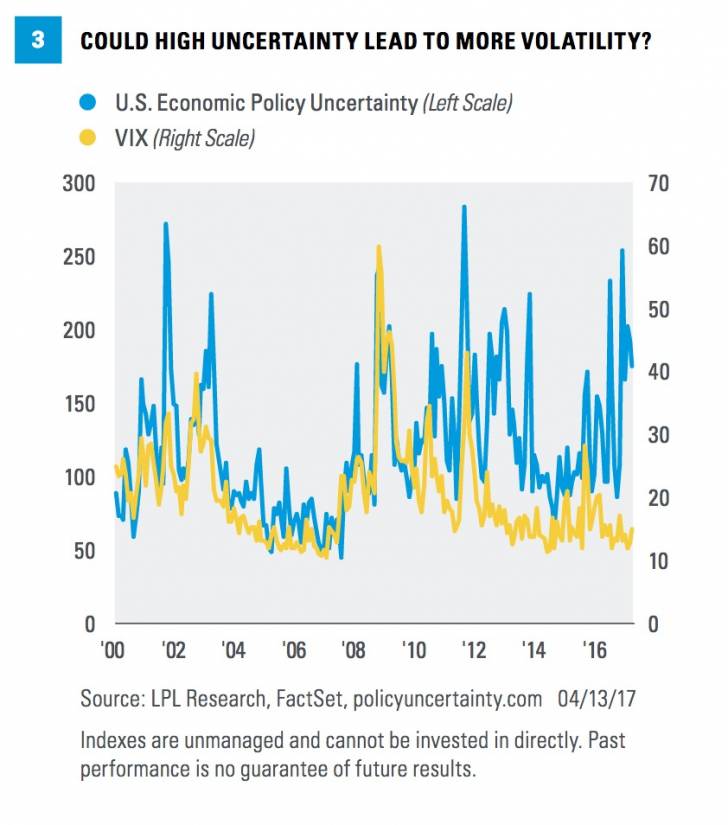
History has seen spikes in volatility during times of economic uncertainty. According to the Economic Policy Uncertainty Index, U.S. economic uncertainty has spiked significantly since late 2016. Interestingly, there has not yet been the subsequent spike in volatility seen during times of uncertainty [Figure 3].
Conclusion
Longer-term technicals continue to look firm and, we believe, suggest potential higher prices. Sentiment is more of a mixed picture, which coupled with high uncertainty may lead to increased volatility. Given 2017 has been historically calm for equities so far, it is reasonable to expect a bumpier ride later this year; but any dips may end up being nice buying opportunities.
Thanks to David Tonaszuck for his contributions this week.
IMPORTANT DISCLOSURES
The opinions voiced in this material are for general information only and are not intended to provide specific advice or recommendations for any individual. To determine which investment(s) may be appropriate for you, consult your financial advisor prior to investing. All performance referenced is historical and is no guarantee of future results.
The economic forecasts set forth in the presentation may not develop as predicted and there can be no guarantee that strategies promoted will be successful.
Investing in stock includes numerous specific risks including: the fluctuation of dividend, loss of principal, and potential liquidity of the investment in a falling market.
All investing involves risk including loss of principal.
INDEX DESCRIPTIONS
The Standard & Poor’s 500 Index is a capitalization-weighted index of 500 stocks designed to measure performance of the broad domestic economy through changes in the aggregate market value of 500 stocks representing all major industries.
The NYSE Composite Index is a float-adjusted market-capitalization weighted index which includes all common stocks listed on the NYSE, including ADRs, REITs and tracking stocks and listings of foreign companies. The index was recalculated to reflect a base value of 5,000 as of December 31, 2002.
The Dow Jones Industrial Average is a price-weighted average of 30 blue-chip stocks that are generally the leaders in their industry. It has been a widely followed indicator of the stock market since October 1, 1928.
The Dow Jones Transportation Average is a price-weighted average of 20 U.S. transportation stocks. The average as it is known today began on October 26, 1896. It was formerly known as the Dow Jones Railroad Average.
The NASDAQ Composite Index is a broad-based capitalization-weighted index of stocks in all three NASDAQ tiers: Global Select, Global Market and Capital Market. The index was developed with a base level of 100 as of February 5, 1971.
The Russell 2000 Index is comprised of the smallest 2000 companies in the Russell 3000 Index, representing approximately 8% of the Russell 3000 total market capitalization. The index was developed with a base value of 135.00 as of December 31, 1986.
The MSCI Em (Emerging Markets) Index is a free-float weighted equity index that captures large and mid cap representation across Emerging Markets (EM) countries. The index covers approximately 85% of the free float-adjusted market capitalization in each country.
The MSCI EAFE Index is a free-float weighted equity index. The index was developed with a base value of 100 as of December 31, 1969. The MSCI EAFE region covers DM countries in Europe, Australasia, Israel, and the Far East.
American Association of Individual Investors (AAII) Sentiment Survey measures the percentage of individual investors who are bullish, bearish, and neutral on the stock market for the next six months; individuals are polled from the ranks of the AAII membership on a weekly basis. Only one vote per member is accepted in each weekly voting period.
The Conference Board Consumer Confidence Survey reflects prevailing business conditions and likely developments for the months ahead. This monthly report details consumer attitudes and buying intentions, with data available by age, income, and region. The results are based on surveys conducted among a random sample of households. Target Audience: random sample of U.S. households. Sample Size: approx. 3,000 households.
NFIB Small Business Optimism Index is compiled from a survey that is conducted each month by the National Federation of Independent Business (NFIB) of its members. The index is a composite of ten seasonally adjusted components based on questions on the following: plans to increase employment, plans to make capital outlays, plans to increase inventories, expect economy to improve, expect real sales higher, current inventory, current job openings, expected credit conditions, now a good time to expand, and earnings trend.
The National Association of Active Investment Managers (NAAIM) is a non-profit association of registered investment advisors who provide active money management services. NAAIM's membership ranges from small regional firms to large national firms with over $1 billion AUM. NAAIM engages in numerous activities to promote active management and further the professional development of its members.
The Chicago Board Options Exchange (CBOE) Volatility Index shows the market's expectation of 30-day volatility. It is constructed using the implied volatilities of a wide range of S&P 500 index options. This volatility is meant to be forward looking, is calculated from both calls and puts, and is a widely used measure of market risk, often referred to as the "investor fear gauge."
Copyright © LPL Financial