
For this week’s Equity Leaders Weekly, we are going to take a look at the volatile 30-Yr Interest Rate Yield , where the back and forth debate on future US interest rate moves continue. We will also be relooking at the very related US Dollar Index as its movements closely mirror interest rate yields with the day to day speculations and commentary on the US Federal Reserve.
CBOE 30-Year Interest Rate (TYX.I)
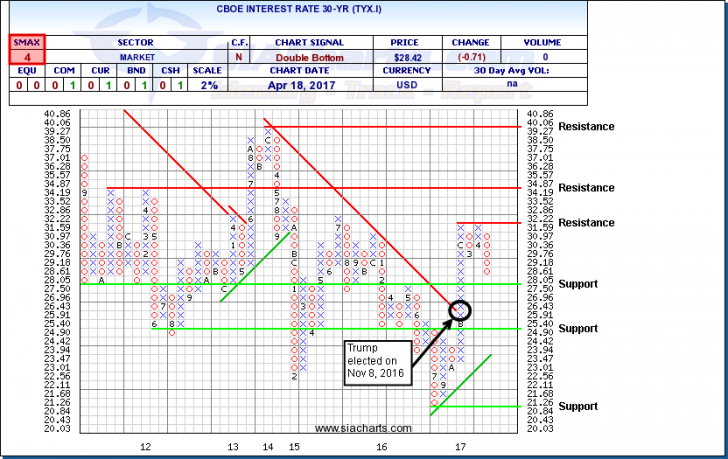
We last looked at Treasury yields at the end of November, just three weeks after the Presidential vote. U.S. interest rates had continued to rise, driving down bond prices, until mid-December before consolidating sideways. The aftermath of the election and also the potential policy implications with this new administration was felt not only in the interest rate yields, but also within the relative strength rankings of various duration and credit quality fixed income investments both within the US universe but also on an international scale.
The most noteworthy event for the recent quarter took place on March 15 when the Federal Reserve increased its benchmark interest rate by 25 basis points to the 0.75%-1.00% target range. This was the third interest rate hike since December 2015 and the second time in three months, but the tone which followed from Janet Yellen was less hawkish then the market seemed to expect which initiated a drop in yields.
As you can see on the chart, the long column of X’s that started in October for the CBOE 30-Yr Interest Rate (TYX.I) had continued since its breakthrough of the long-term trend line, which had been in place since 2013. The post-Trump win rally continued until the end of 2016 where it began a 3-month trading range, bouncing between resistance at 3.22% and (prior) support at 2.92%. With the recent move below 2.90%, we now find additional support at 2.75%, and then lower at 2.49% and 2.08%. Upside resistance is found at 3.22%, 3.487%, and much higher at 4.01%. With a dramatically different SMAX than late last year, the score of 4 out of 10 for TYX.I is showing near-term weakness relative to the asset classes.
US Dollar Index Continuous Contract (DX2.F)
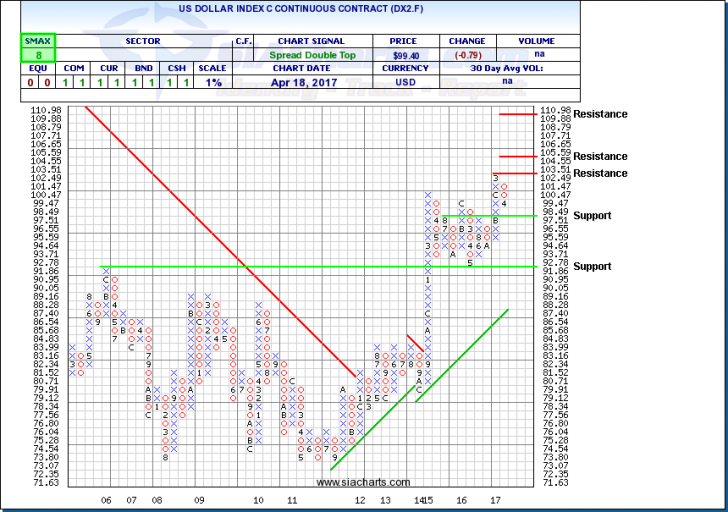
The US Dollar Index is a broad measure of the value of the United States dollar relative to a basket of foreign currencies. This basket includes the following currencies: Euro (58%), Japanese yen (14%), Pound Sterling (12%), Canadian dollar (9%), Swedish krona (4.2%), and Swiss franc (3.6%).
Similar to the yield chart, the strength and momentum that the US Dollar witnessed after the election, had also peaked in mid-December. So far for the year, the index has been range bound bouncing between the 99 and 102. Turning to the Chart of DX2.F, we can see that it is bound by close resistance and support levels at 103.51 and 97.51 respectively. Further resistance is seen around 105 and then higher at the 110 level. Additional and significant support is found much lower at 91.86 With an SMAX of 8 out of 10, the US Dollar Index is continuing to show near-term strength against the asset classes.
For a more in-depth analysis on the relative strength of the equity markets, bonds, commodities, currencies, etc. or for more information on SIACharts.com, you can contact our sales and customer support at 1-877-668-1332 or at siateam@siacharts.com.
SIACharts.com specifically represents that it does not give investment advice or advocate the purchase or sale of any security or investment. None of the information contained in this website or document constitutes an offer to sell or the solicitation of an offer to buy any security or other investment or an offer to provide investment services of any kind. Neither SIACharts.com (FundCharts Inc.) nor its third party content providers shall be liable for any errors, inaccuracies or delays in content, or for any actions taken in reliance thereon.
Copyright © SIACharts.com