by Ryan Detrick, LPL Research
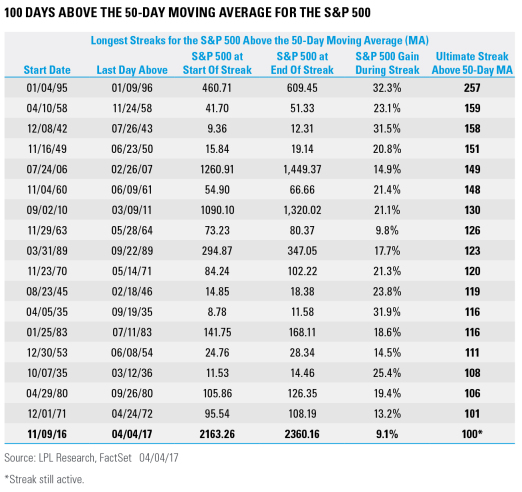
How persistent has the rally been since the U.S. election? We’ve shown this many ways, but here’s yet another great example. Yesterday, the S&P 500 Index closed for the 100th trading day in a row above its 50-day moving average. Using historical data back to 1928*, this is only the 18th time the S&P 500 has ever made it to 100 days and the first time it has happened in more than six years.
Although 100 days is a long time, it still has a long ways to go to reach the record of 257 days set in 1995, as noted in the chart below:
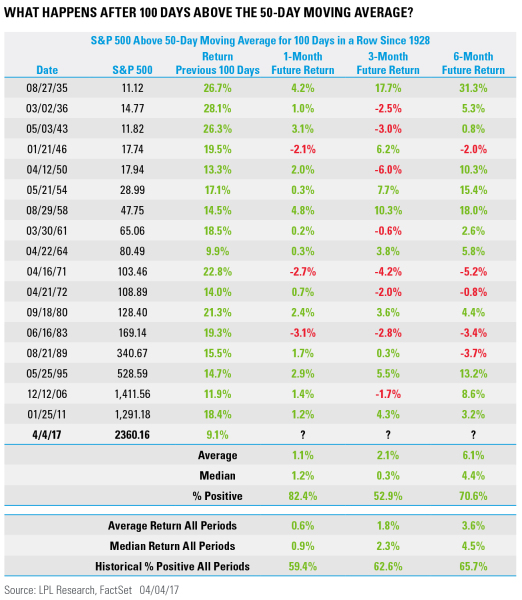
When you see there was a streak of more than 100 days in 2007, ahead of the Financial Crisis, the next question is, do these trends signal a potential warning? As the next chart shows, that fortunately doesn’t appear to be the case. Per Ryan Detrick, Senior Market Strategist, “Looking at the other times the S&P 500 traded above its 50-day moving average for 100 days or more, the subsequent 1-, 3-, and 6-month average returns are better than the average return for all comparable periods. In other words, you might think these long runs should lead to a well-deserved break, but history suggests that isn’t always the case.”
Last, note that the recent 100-day return was only 9.1%, the weakest out of all the previous streaks. In fact, only one other time did a streak return less than 10%, and that was in 1964. Is this a sign of a weakening trend? Or could it be a market that still has plenty left in the tank? Please continue to follow LPL Research as we continually analyze that important question.
IMPORTANT DISCLOSURES
* Please note: The modern design of the S&P 500 stock index was first launched in 1957. Performance back to 1928 incorporates the performance of its predecessor index, the S&P 90.
Past performance is no guarantee of future results. All indexes are unmanaged and cannot be invested into directly.
The opinions voiced in this material are for general information only and are not intended to provide or be construed as providing specific investment advice or recommendations for any individual security.
The economic forecasts set forth in the presentation may not develop as predicted.
Investing in stock includes numerous specific risks including: the fluctuation of dividend, loss of principal and potential illiquidity of the investment in a falling market.
Stock investing involves risk including loss of principal.
The Standard & Poor’s 500 Index is a capitalization-weighted index of 500 stocks designed to measure performance of the broad domestic economy through changes in the aggregate market value of 500 stocks representing all major industries.
This research material has been prepared by LPL Financial LLC.
To the extent you are receiving investment advice from a separately registered independent investment advisor, please note that LPL Financial LLC is not an affiliate of and makes no representation with respect to such entity.
Not FDIC/NCUA Insured | Not Bank/Credit Union Guaranteed | May Lose Value | Not Guaranteed by any Government Agency | Not a Bank/Credit Union Deposit
Securities and Advisory services offered through LPL Financial LLC, a Registered Investment Advisor Member FINRA/SIPC
Tracking # 1-597048 (Exp. 4/18)
Copyright © LPL Research


