In today’s SIA Equity Leaders Weekly, in light of action from the US Federal Reserve yesterday, we are going to revisit the #1 ranked asset class, US Equity, through the S&P 500 Index. We will also look at crude oil once again as the commodity fell through some key support since it was last discussed.
On Wednesday, the Federal Reserve increased its benchmark interest rate by 25 basis points to the 0.75%-1.00% target range. This is the third interest rate hike since December 2015 and the second time in three months. The central bank’s policy makers showed more unity with a vote of 9-to-1 noting that headline inflation is “moving close” to its 2% target while other data points are signaling continued strength in the US economy coming from strong jobs report last week. The United States has added jobs for 77 consecutive months while the unemployment rate has fallen to 4.7%. Although this interest rate increase did not come as a surprise to many, the Fed did not change its tone and still projects two more interest rate hikes this year as consumers and businesses can afford to continue to operate with less assistance from ultra-low interest rates.
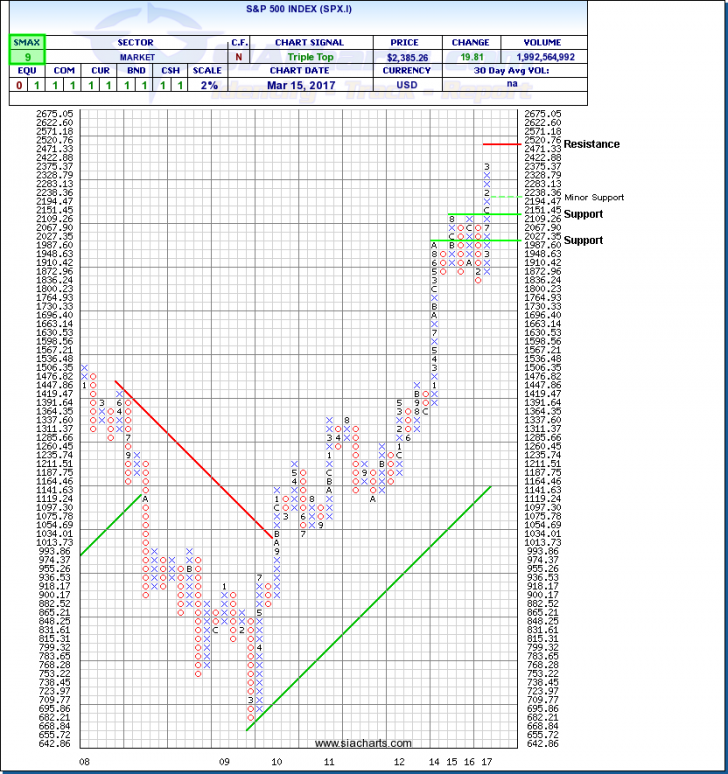
S&P 500 Index (SPX.I)
The markets responded well to the news from the Fed yesterday, closing at 2385.26, up 0.84% on the day. The index has now gone 106 days without giving up more than 1% in one trading day which is the longest streak since December 18, 1995.
We last looked at SPX.I on Dec 29, 2016 where it was sitting at 2249.92. Since then, the index has added 3 more X’s to the column, getting as high as 2395.96 at the beginning of March. Should this rally continue, the next level of resistance for SPX.I is likely the 2500 psychological level. Support can be found at 2109.26 and 2000.
Remaining in the # 1 spot in the Asset Class Ranking, and with an SMAX score of 9 out of 10, the S&P 500 Index is showing near term strength versus the broad asset classes on a near and intermediate-term basis.
Click on Image to Enlarge
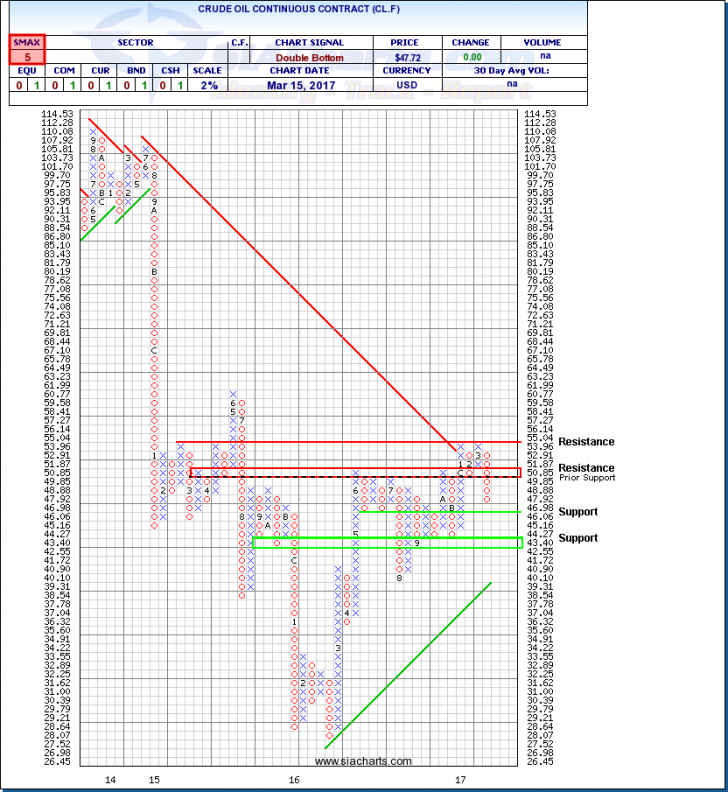
Crude Oil Continuous Contract (CL.F)
Crude oil halted their losing streak on Wednesday after seven straight days of losses to close at $47.72/bbl, up 2.6% on the day. The Fed’s decision to raise rates, but not accompanied by a more hawkish tone, pushed the USD down during the final hours of the trading day, providing support for dollar-denominated barrels of oil. The U.S. Energy Information Administration reported early Wednesday a drop in domestic crude-oil supplies of 200,000 barrels for the week ended March 10 – the first weekly draw in 10 weeks amid analyst expectations of an increase in supplies.
Besides Wednesday's uptick in price, CL.F finds itself having fallen through the previous support at $50 over the past week, and remains below this level. In looking at the chart we can still see that crude is well within its historical trading ranges, and looks to remain relatively consolidated with strong support and resistance levels on either side. Support for CL.F can be found at $46.06 and ~$43.00, with upside resistance coming in around $50-$51 and above that at $55.
With an SMAX of 5 out of 10 and the Commodities asset class in the #6 spot of the SIA Asset Class Rankings, CL.F is not showing very little near and longer term relative strength versus the asset classes.
For a more in-depth analysis on the relative strength of the equity markets, bonds, commodities, currencies, etc. or for more information on SIACharts.com, you can contact our sales and customer support at 1-877-668-1332 or at siateam@siacharts.com.
Click on Image to Enlarge
SIACharts.com specifically represents that it does not give investment advice or advocate the purchase or sale of any security or investment. None of the information contained in this website or document constitutes an offer to sell or the solicitation of an offer to buy any security or other investment or an offer to provide investment services of any kind. Neither SIACharts.com (FundCharts Inc.) nor its third party content providers shall be liable for any errors, inaccuracies or delays in content, or for any actions taken in reliance thereon.
Copyright © SIACharts.com