by Ryan Detrick, LPL Research
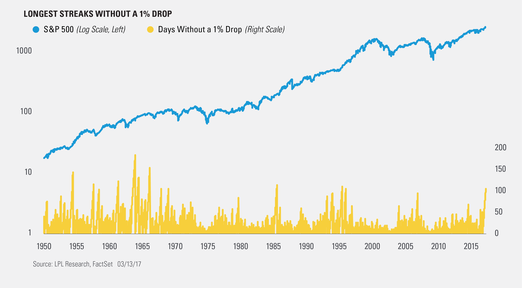
The S&P 500 Index has now gone 104 days in a row without a 1% close lower. Should it avoid a 1% drop today, this will tie the longest streak without a 1% close lower since late 1995. Although this is no doubt a long streak, it puts in perspective the 78 years that Northwestern fans had to wait to make the NCAA tournament!
Does this mean the crowd is complacent? Many have claimed recently that the lack of volatility is a sign of extreme complacency. Use yesterday for example—the S&P 500 traded in a range of only 0.25%, the smallest daily range so far this year and in the bottom 0.2% of all daily ranges since 1970. In fact, the S&P 500 hasn’t moved in a daily range of more than 1% for an incredible 59 days in a row, the longest such streak going back 50 years and trouncing the previous record of 34 from 1995. Of course, 1995 wasn’t the worst time to be long equities for the next several years.
So, is this a sign of complacency? There are many ways to measure market sentiment, but it is worth noting that the number of bears in the recent American Association of Individual Investors (AAII) Sentiment Survey was the highest in more than a year, and active managers, as measured by the National Association of Active Investment Mangers (NAAIM) Exposure Index, had their lowest equity exposure of the year. Those are only two examples, but it sure doesn’t look like much complacency.
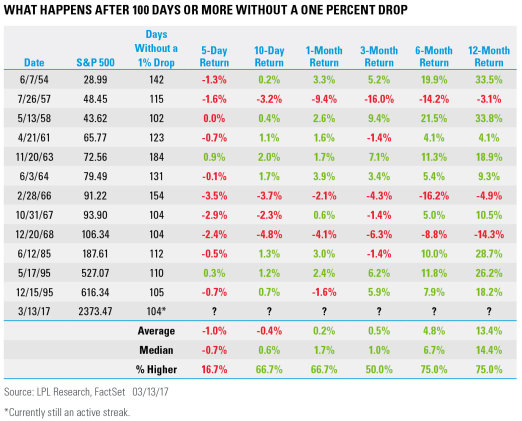
Per Ryan Detrick, “The lack of volatility is historic in its own right, but is it bearish? History would say we can expect more volatility eventually, but this doesn’t mean to be on the lookout for a major correction either. In fact, after a streak of 100 or more days without a 1% drop has ended, the S&P 500 has been up a very impressive median return of 14.4% a year later and higher 75% of the time. In other words, a lack of big down days or a lack of volatility by itself isn’t a warning sign.”
For more on our thoughts on if this bull market can make it to its ninth birthday next year, be sure to read How Much Is Left In The Tank?
IMPORTANT DISCLOSURES
Please note: The modern design of the S&P 500 stock index was first launched in 1957. Performance back to 1950 incorporates the performance of predecessor index, the S&P 90.
Past performance is no guarantee of future results. All indexes are unmanaged and cannot be invested into directly.
The opinions voiced in this material are for general information only and are not intended to provide or be construed as providing specific investment advice or recommendations for any individual security.
The economic forecasts set forth in the presentation may not develop as predicted.
Investing in stock includes numerous specific risks including: the fluctuation of dividend, loss of principal and potential illiquidity of the investment in a falling market.
Stock investing involves risk including loss of principal.
The S&P 500 Index is a capitalization-weighted index of 500 stocks designed to measure performance of the broad domestic economy through changes in the aggregate market value of 500 stocks representing all major industries.
This research material has been prepared by LPL Financial LLC.
To the extent you are receiving investment advice from a separately registered independent investment advisor, please note that LPL Financial LLC is not an affiliate of and makes no representation with respect to such entity.
Not FDIC/NCUA Insured | Not Bank/Credit Union Guaranteed | May Lose Value | Not Guaranteed by any Government Agency | Not a Bank/Credit Union Deposit
Securities and Advisory services offered through LPL Financial LLC, a Registered Investment Advisor Member FINRA/SIPC
Tracking # 1-590330 (Exp. 3/18)
Copyright © LPL Research


