
What they fail to mention is that, because stock market volatility clusters during periods of market crisis, the best daily and monthly stock market returns are directly adjacent in time to the worst monthly returns. In fact, investors would be considerably better off missing both the best and worst days or months in the market. These investors would realize the same gains as buy-and-hold investors, but with much less grief in the form of volatility and drawdowns. Simple trend-following strategies work for precisely this reason.
Missing both the Best AND Worst Periods Improves Performance
Missing the best months is roughly equivalent in terms of long-term total returns to missing the worst months, just in the opposite direction. For example, investors drop about 2% per year when missing the best 10 months, and add about 2% per year when missing the 10 worst months. In fact, you can see from Figure 1 that investors that miss both the 10 best AND worst months end up with slightly better returns than the market, but with much less volatility and smaller drawdowns.
Figure 1.
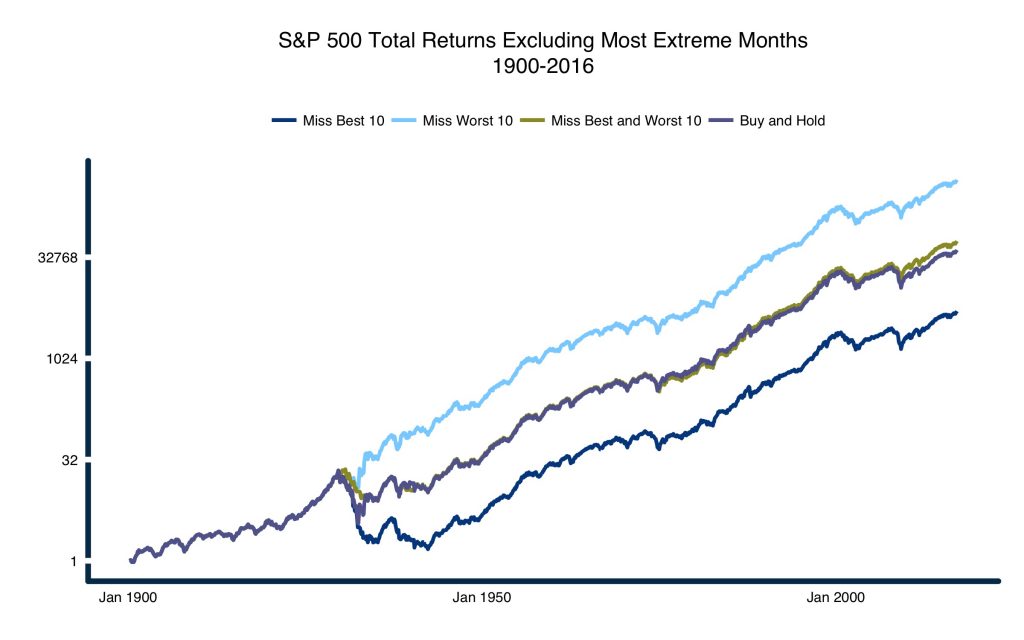
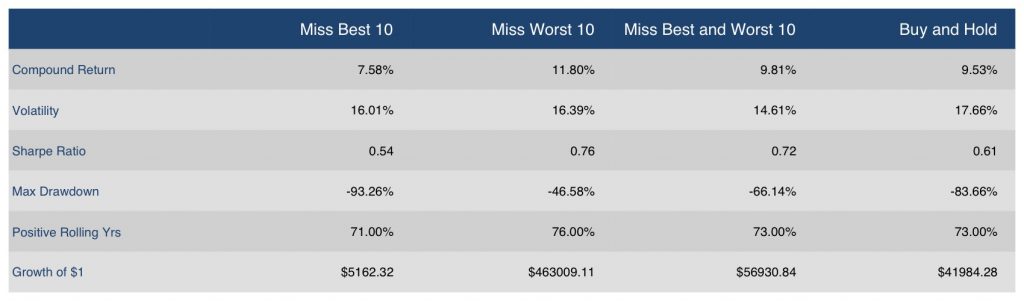
Source: ReSolve Asset Management. Data from Robert Shiller.
In fact, per Figure 2 there is a progressive improvement in returns coupled with reductions in both volatility and maximum drawdowns as increasing numbers of best AND worst performance months are excluded. An investor who managed to miss the most extreme 50 monthly returns would have experienced slightly higher compound returns than a buy-and-hold investor since 1900, with 25% less volatility and less than half the maximum drawdown. Note that this investor would have been in the market almost 97% of the time.
Figure 2.
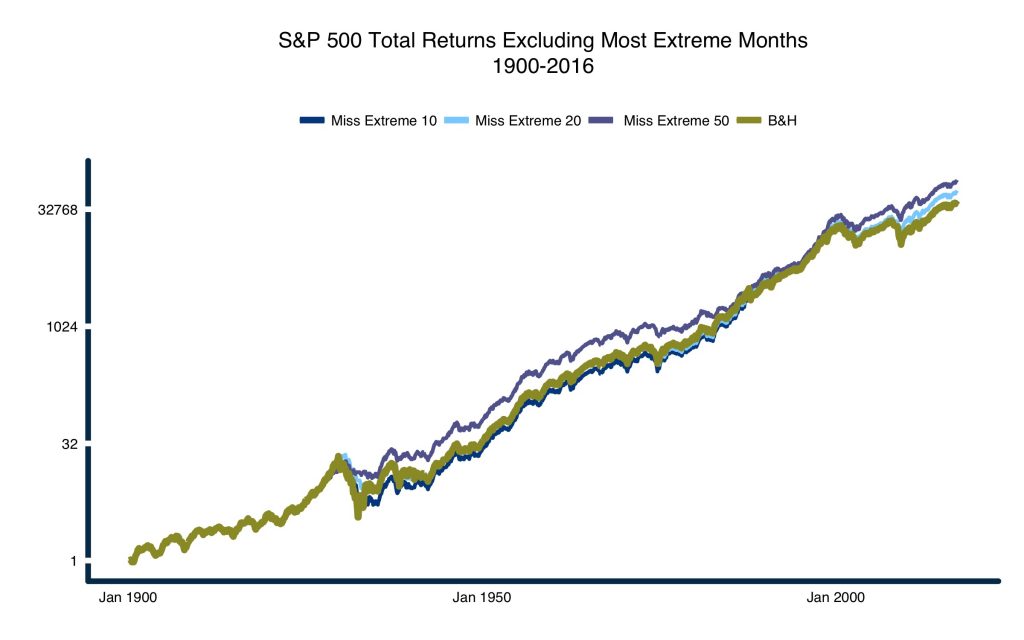
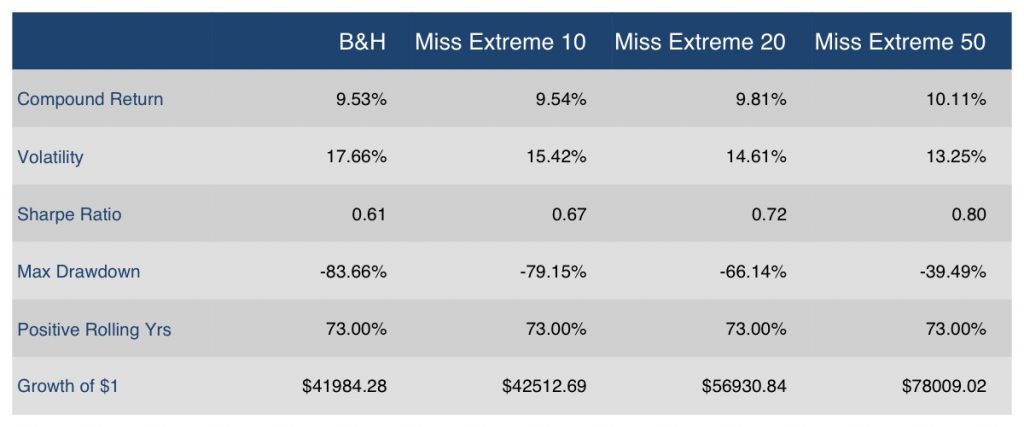
Source: ReSolve Asset Management. Data from Robert Shiller.
Momentum as a Method to Avoid Crisis Markets
If we can improve risk-adjusted performance by avoiding the best and worst months, and these months tend to cluster together during periods of market crisis, it prompts the question: is there a simple way to avoid these extreme periods? It turns out there is. Simple trend-following/momentum rules are effective for exactly this reason. They work because extreme returns tend to occur when markets are in steep downtrends.
Consider Meb Faber’s simple 10-month moving average strategy (also discussed in Siegel’s “Stocks for the Long Run”). When we apply this strategy to the S&P 500, results are remarkably similar to what we observe when we miss the most extreme months: similar returns, with lower volatility and smaller drawdowns. Note that this example assumes an investor earns nothing when he is cash – returns exceed the returns of buy-and-hold when cash returns are included.
Figure 3.
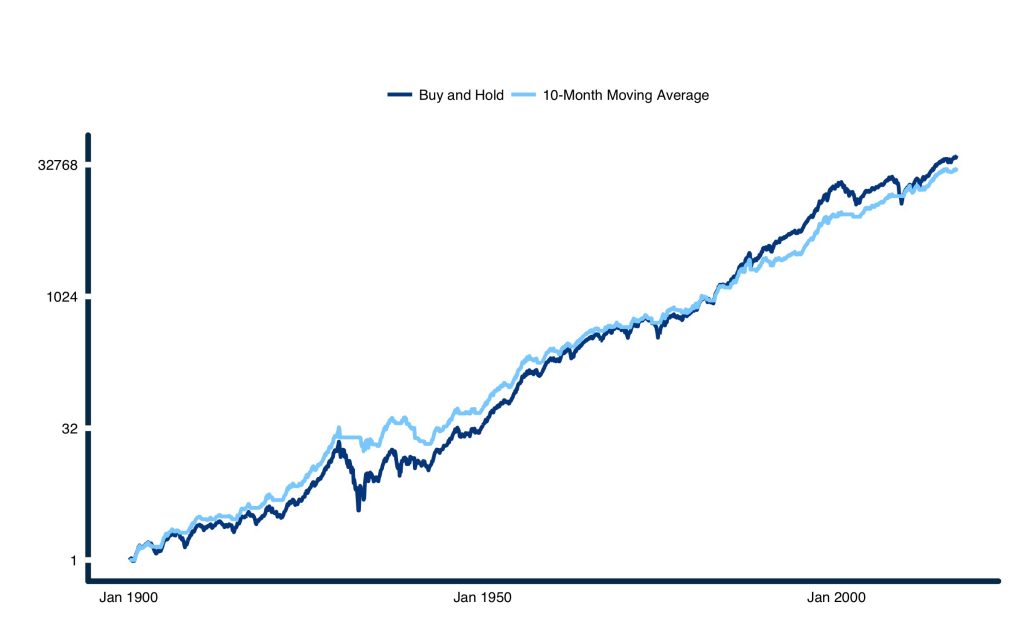
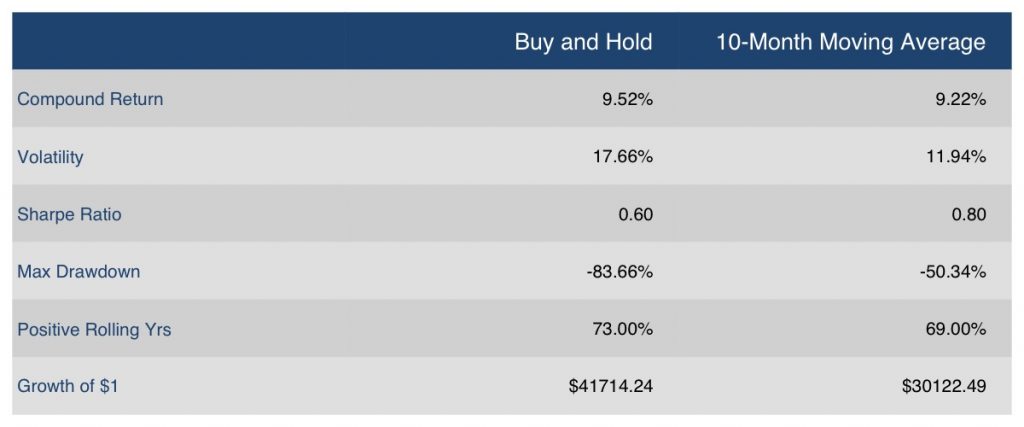
Source: ReSolve Asset Management. Data from Robert Shiller.
From a risk-adjusted performance perspective, a simple 10-month moving average rule – a simple indicator of positive or negative momentum – produced results that are competitive with what we observe from a strategy that manages to avoid the 50 best and worst months since 1900.
Trend Following (aka Momentum) is Robust across Asset Classes
Were this phenomenon isolated to US stocks, it might be easy to dismiss. But the behavior of diverse asset classes above and below their respective 10-month moving averages displays remarkably similar characteristics. Specifically, when the market is experiencing negative moment, or even crisis (as indicated by being below its 10-month moving average), asset classes yield significantly lower returns, and at higher risk.
Figure 4.
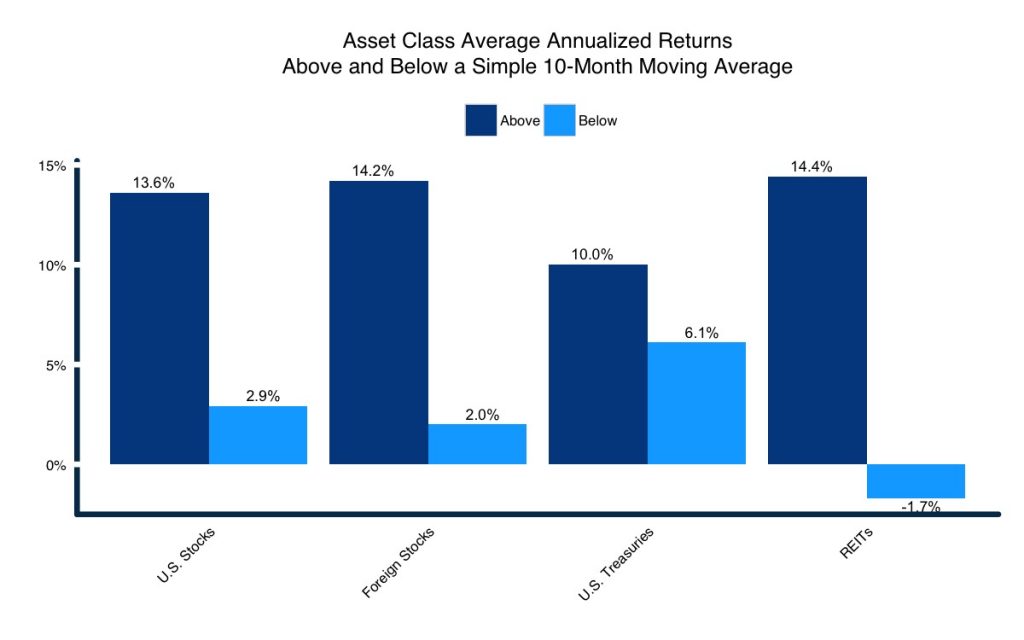
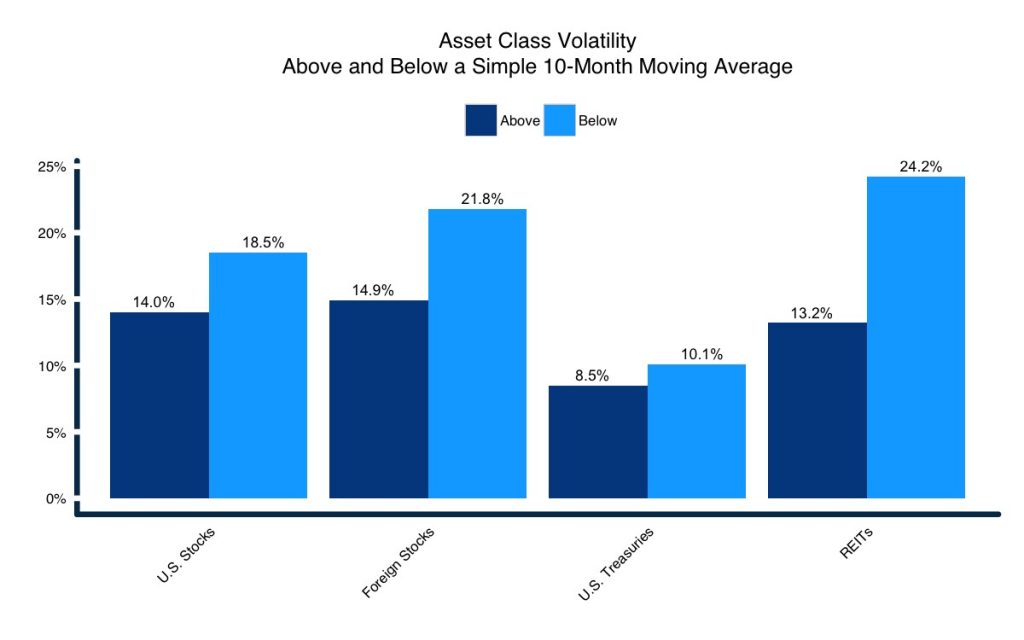
Source: ReSolve Asset Management. Data from Robert Shiller.
Using Momentum to Build a Simple Diversification Model
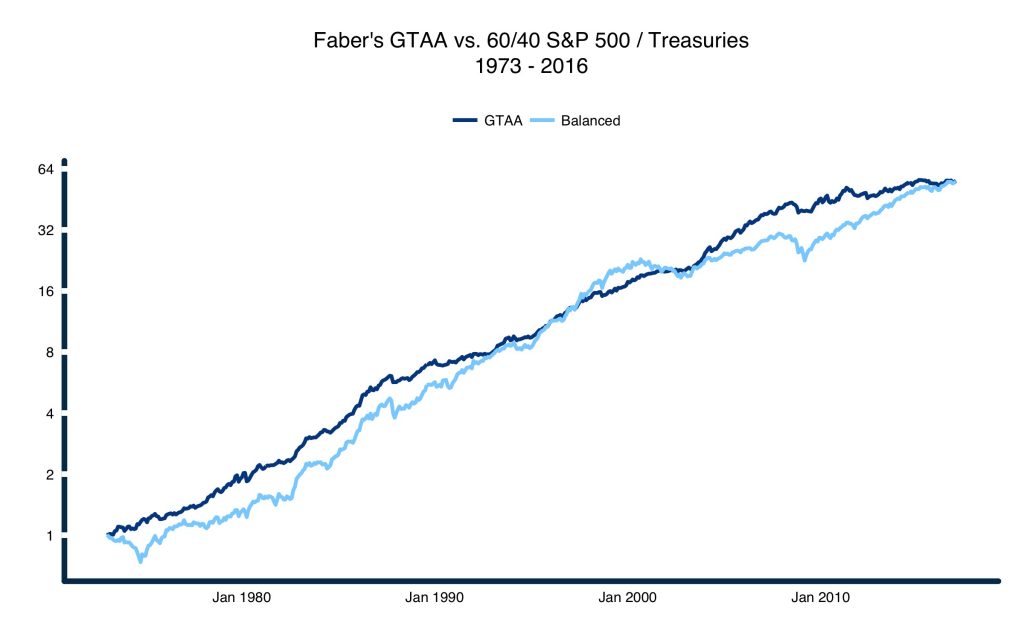
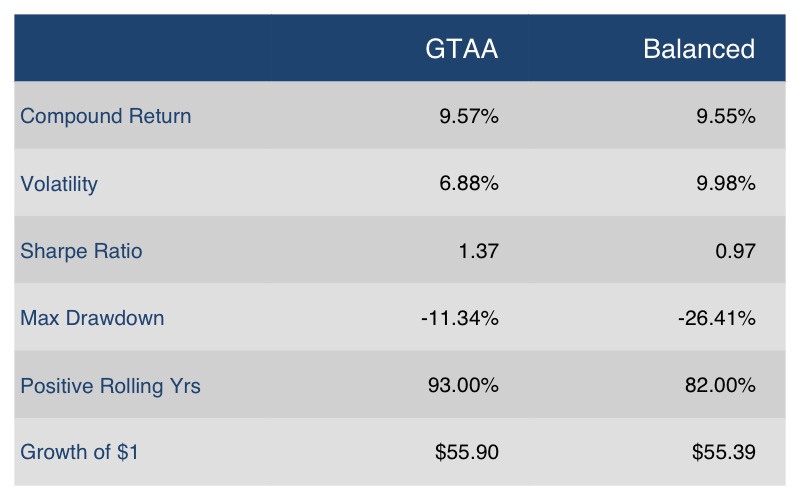
When we apply the simple moving average rule to the five assets in Figure 3, not only do we benefit from avoiding the most extreme months, but we also accrue substantial diversification benefits. Note that this simple strategy – first described by Mebane Faber in 2006 – produced returns just slightly below those of the S&P 500, but with just one-third the volatility and maximum drawdown from 1973 through the end of 2016.
Figure 5.
 Source: ReSolve Asset Management. Data from AllocateSmartly and Global Financial Data
Importantly, the GTAA strategy is a simple, rules-based strategy that does not rely on gut instinct, macroeconomic analysis, narratives, political insight, or any other discretionary intuition. It is a rules-based approach that relies on one of the most widely recognized, persistent, pervasive, and economically significant risk premia in markets – time-series momentum. It may not be the best way to harness this effect, but it is remarkably effective for such a simple strategy.
The point is, when absorbing content on markets and investing it pays to be aware of the economic incentives behind the material. Clearly, the mutual fund industry and large issuers of passive index products are highly motivated to keep you invested through thick and thin. On the other hand (full disclosure), ReSolve offers active asset allocation solutions – similar to GTAA – based on time-series momentum and other proven strategies – with the goal of delivering strong, stable returns in good times and bad. So yes, we have a dog in this fight.
To learn about our dog, click here.
NOTE: The Sharpe ratios in this article are simple ratios of compound return to risk, and do not include a risk-free rate.
Copyright © Resolve Asset Management