By Brad McMillan, Chief Investment Officer, Commonwealth Financial Network
“Those who cannot remember the past are condemned to repeat it.” — George Santayana
Every so often, I like to look back. Not too often, because life is lived moving forward. Occasionally, though, we can learn a lot about where we are going from considering where we've been.
A look back at the market
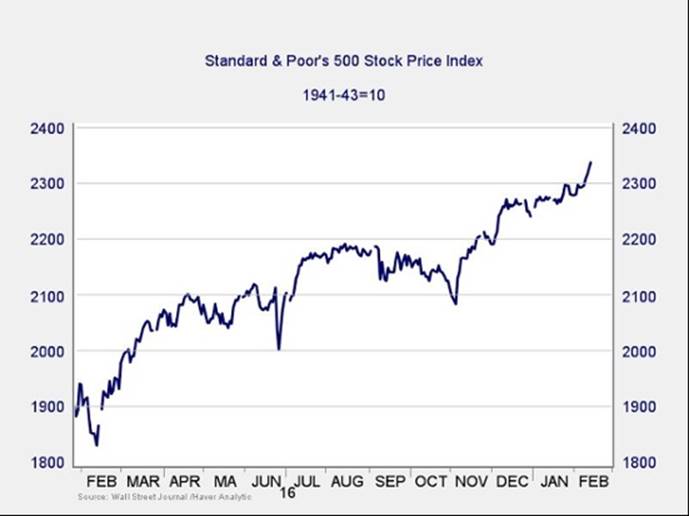
The past year: The S&P 500 is now at record highs and moving higher, well above where it was early last year. There have been significant gains in U.S. stocks. Investors are cheerful (as well they should be) because those gains are based on both improving fundamentals and sentiment.
For a slightly different perspective, we can look at the gains (or losses) over the previous 12 months from each date. Last February, for example, the market was down more than 10 percent year-on-year. Then, in August, the market was up more than 15 percent, only to lose that gain into November. Now, of course, it’s up nearly 25 percent year-on-year.
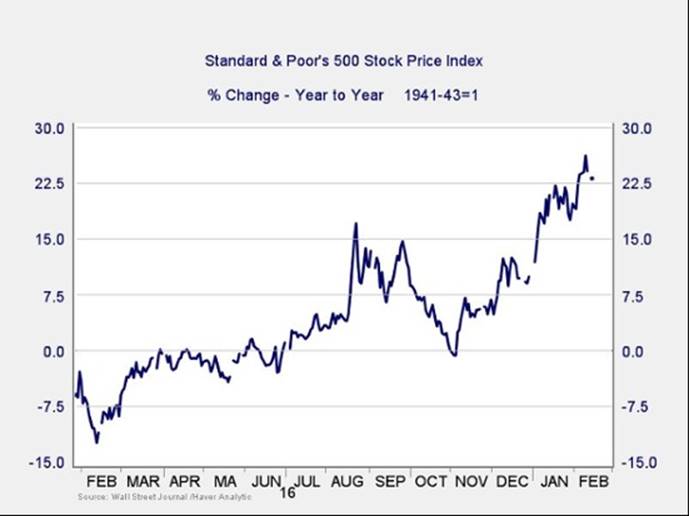
Considering how the market has fluctuated over the past year, we should pause when we start to get too excited (positively or negatively) over short-term developments. When you can swing from a gain of 15 percent to flat performance in a couple of months, as we did from September through November, perhaps it’s wise to remember that short-term results are very volatile, yet can still lead to good longer-term results. You can see this when you compare the trailing-year returns in the second chart above with the upward trend in the first.
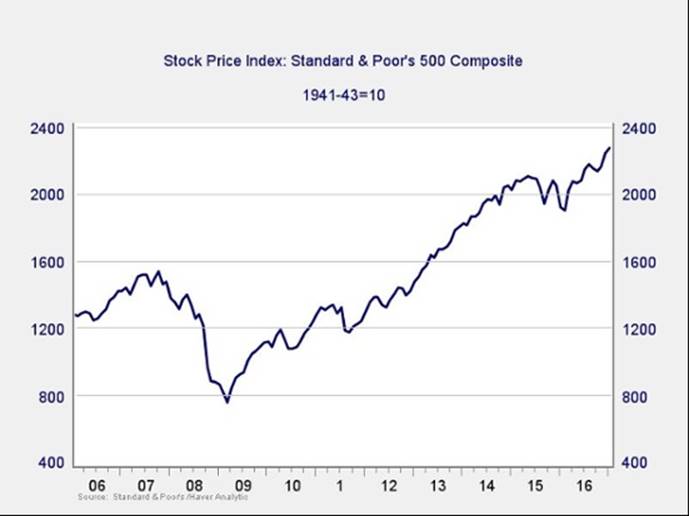
The past 10 years: Now let’s go back a bit further. The next chart shows the last market boom, ending in 2007; the crash; and the current recovery and boom. The long-term trend still looks quite good.
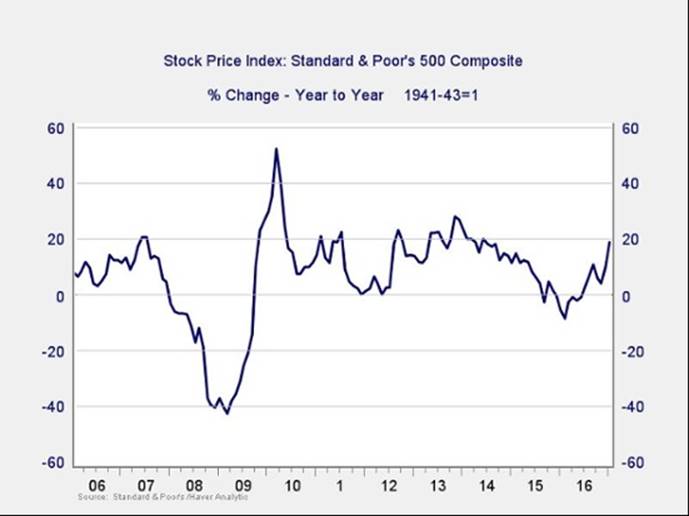
Looking at the rolling year-on-year changes, we again see great volatility, with losses down to 40 percent year-on-year and gains up to about 50 percent. Gains went from low to high over a period of months, and vice versa, many times. Yet, when you compare the annual change with the absolute level, once again, we did pretty well.
A look back at the economy
Bigger picture, we see the same kind of behavior with the U.S. economy as a whole. After the drawdown following the crisis, the economy has bounced back and reached new highs almost every quarter since mid-2011, showing strong growth over the whole 10-year period.
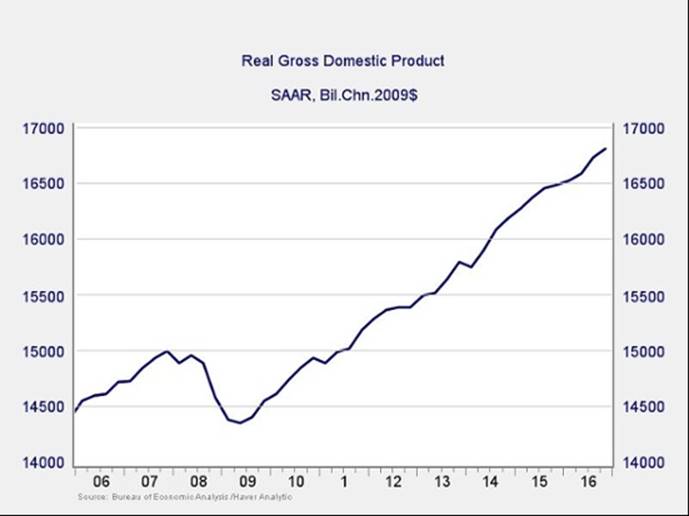
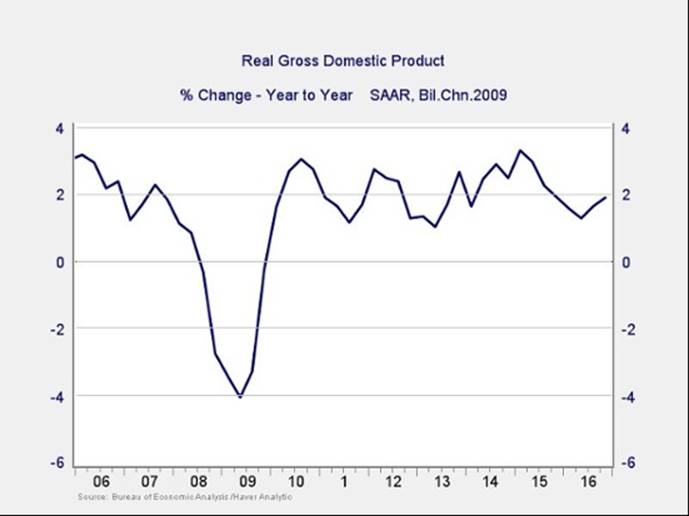
Though year-on-year growth has been volatile—note the effect of the crisis in the chart below—this hasn’t prevented growth over time, at a very healthy level. Short-term volatility is almost irrelevant to longer-term growth.
How to define “the short term”?
Here’s my point: looking at any given month or quarter, the results can be very different, and it’s easy to get excited (or shaken) too quickly. Even looking further back (a year, in this case) still gives us very volatile results. When we talk about the long term and the short term, the short-term horizon clearly extends much further than most people think.
How far? I’ve been playing with between five and ten years, and the results are interesting. Clearly, one year is not an appropriate time frame, but what can we learn from longer time horizons? We will take a closer look at that in the next couple of days.
*****
Brad McMillan is the chief investment officer at Commonwealth Financial Network, the nation’s largest privately held independent broker/dealer-RIA. He is the primary spokesperson for Commonwealth’s investment divisions. This post originally appeared on The Independent Market Observer, a daily blog authored by Brad McMillan.
Forward-looking statements are based on our reasonable expectations and are not guaranteed. Diversification does not assure a profit or protect against loss in declining markets. There is no guarantee that any objective or goal will be achieved. All indices are unmanaged and investors cannot actually invest directly into an index. Unlike investments, indices do not incur management fees, charges, or expenses. Past performance is not indicative of future results.
Commonwealth Financial Network is the nation’s largest privately held independent broker/dealer-RIA. This post originally appeared on Commonwealth Independent Advisor, the firm’s corporate blog.
Copyright © Commonwealth Financial Network